Incidents
Now that everything is set up, you are ready to report your first incident!
Reporting incidents
Go to Incidents in your main navigation menu or create a new incident directly from your dashboard. Choose the severity of the incident in the dropdown menu, with P1 being the highest and P5 being purely informational. Add a title and a summary, so your team knows what’s up. Here's where Incidite AI can help: just throw in a few words for the title to generate a polished summary and a complete description. You can also generate a title from a summary! To contact the right people, select the affected service(s) and decide, which statuspage(s) the incident should be posted on. All of these can be changed on your incident dashboard even when the incident has already been created. The same applies to Maintenance.
Incident dashboard
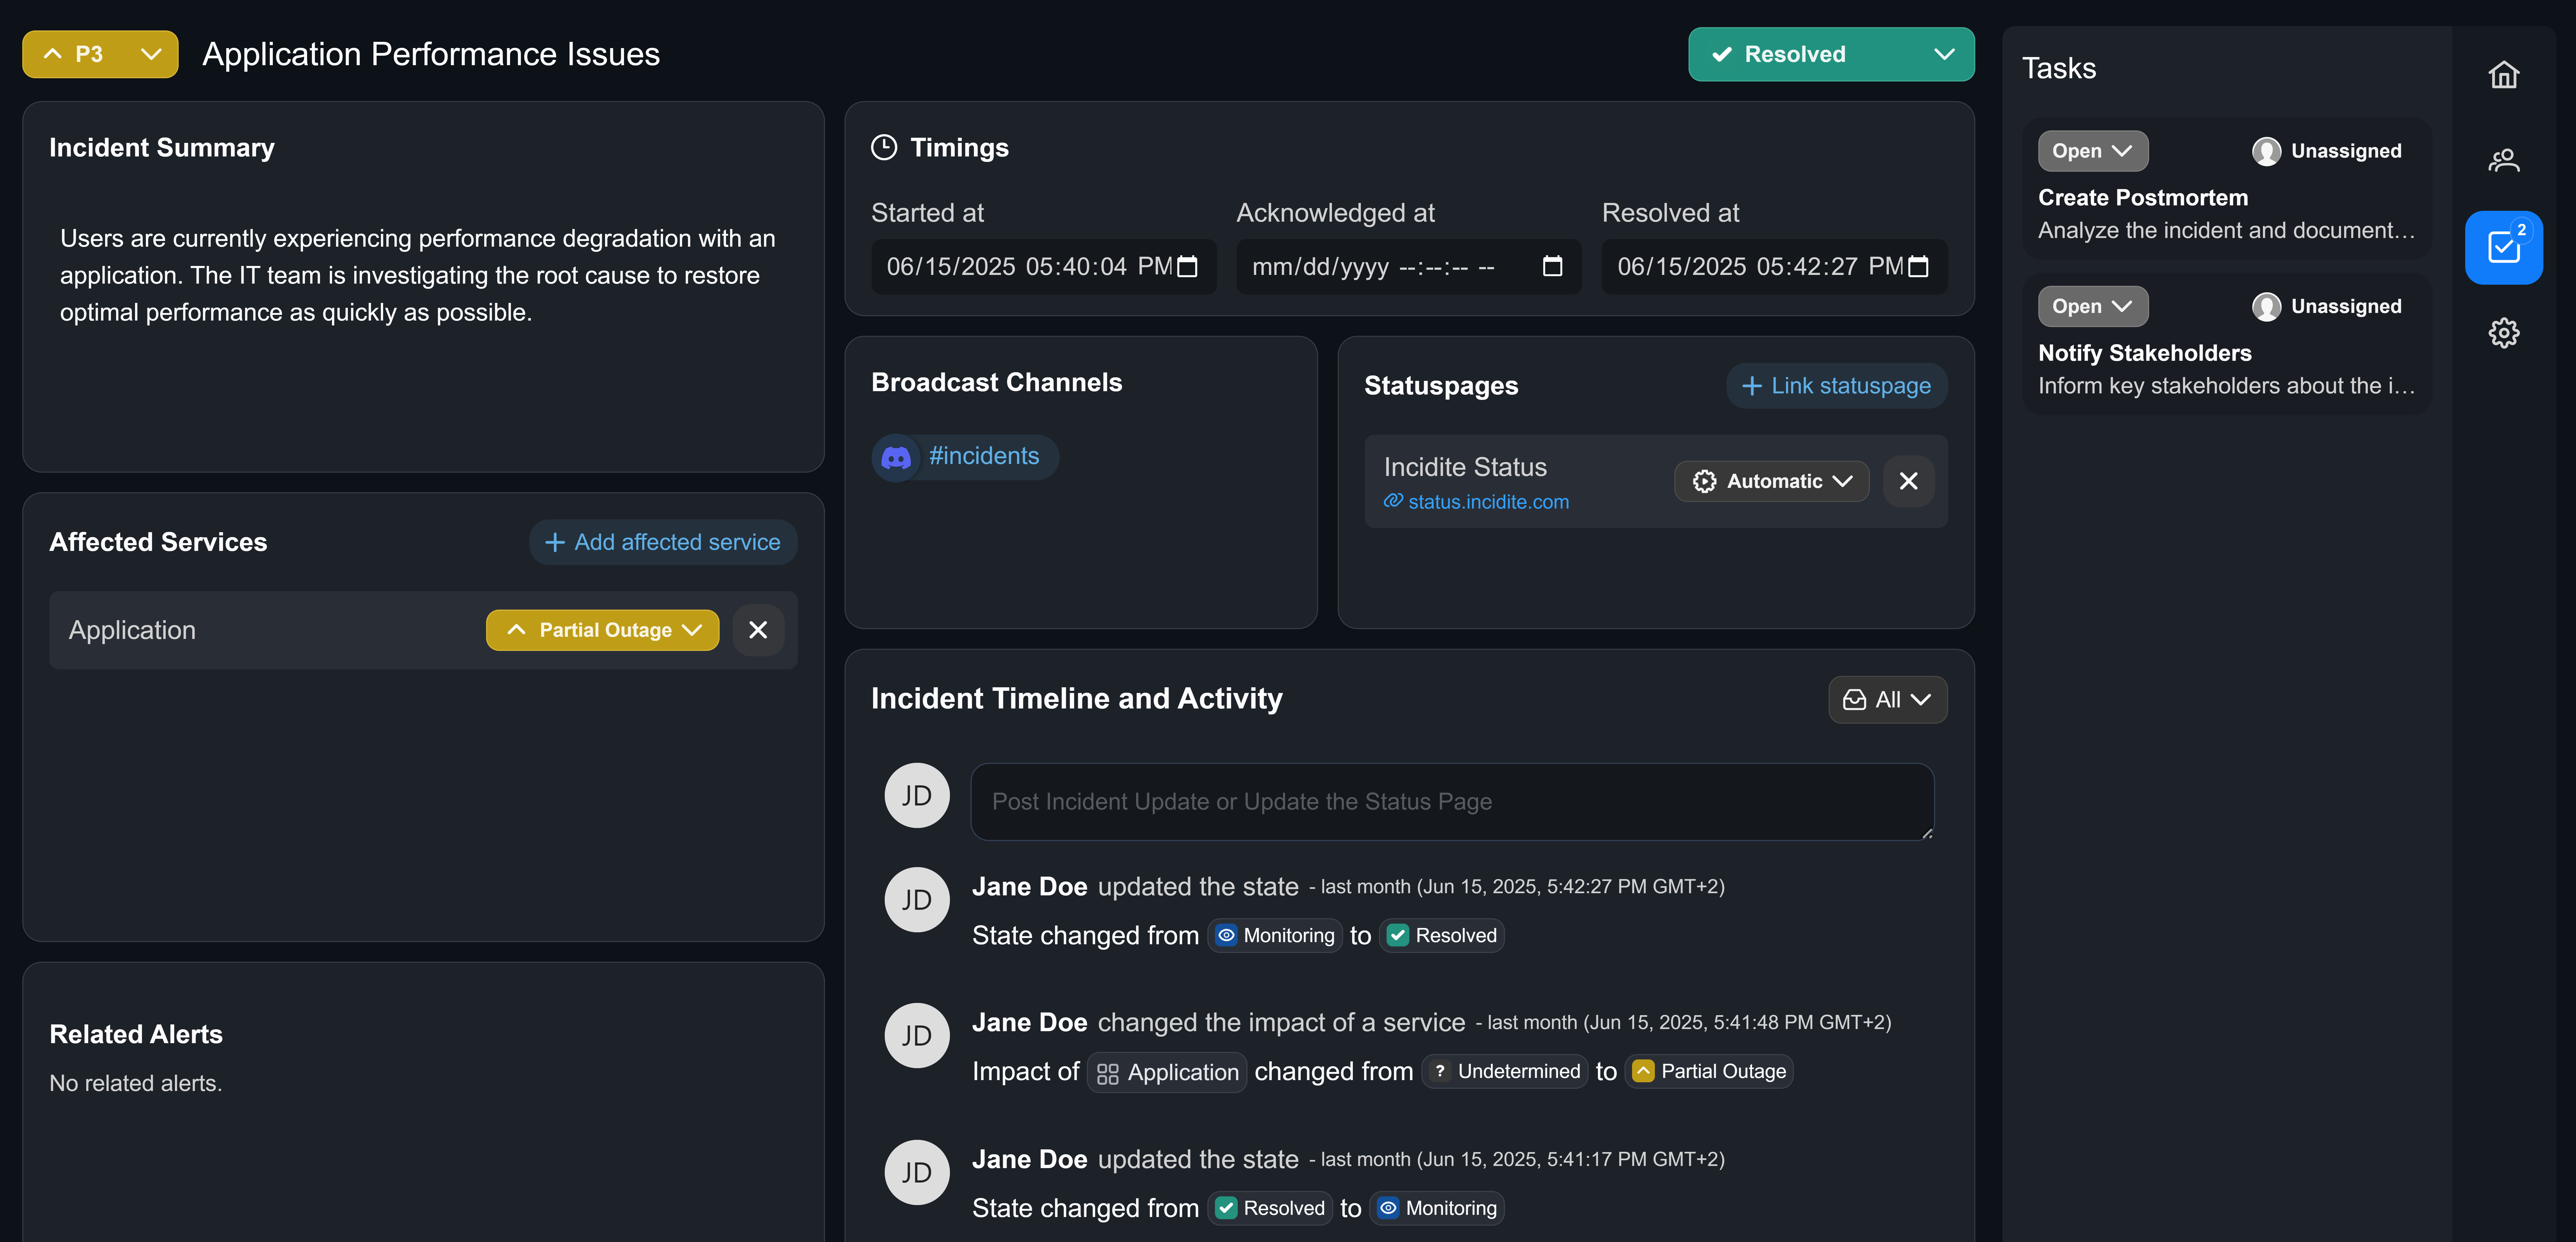
In your incident dashboard you can change the following information at any given time:
- Priority
- Title and summary
- Impact
- Impact timings (Started/Detected/Resolved)
- Affected services
- Statuspages
- Status of the incident (New/Acknowledged/Monitoring/Resolved)
- Affected services and impact level
- Incident roles
- Design (workspace)
This is what your default incident dashboard looks like:
Incident timeline and activity
Your incident dashboard is equipped with a timeline section that logs every change and update to the incident. It also serves as a comment section, in which you can update teammates or customers in real time. When posting a comment you can choose whether or not you want it to be posted to the linked statuspage and if subscribers should be notified.

Workspaces
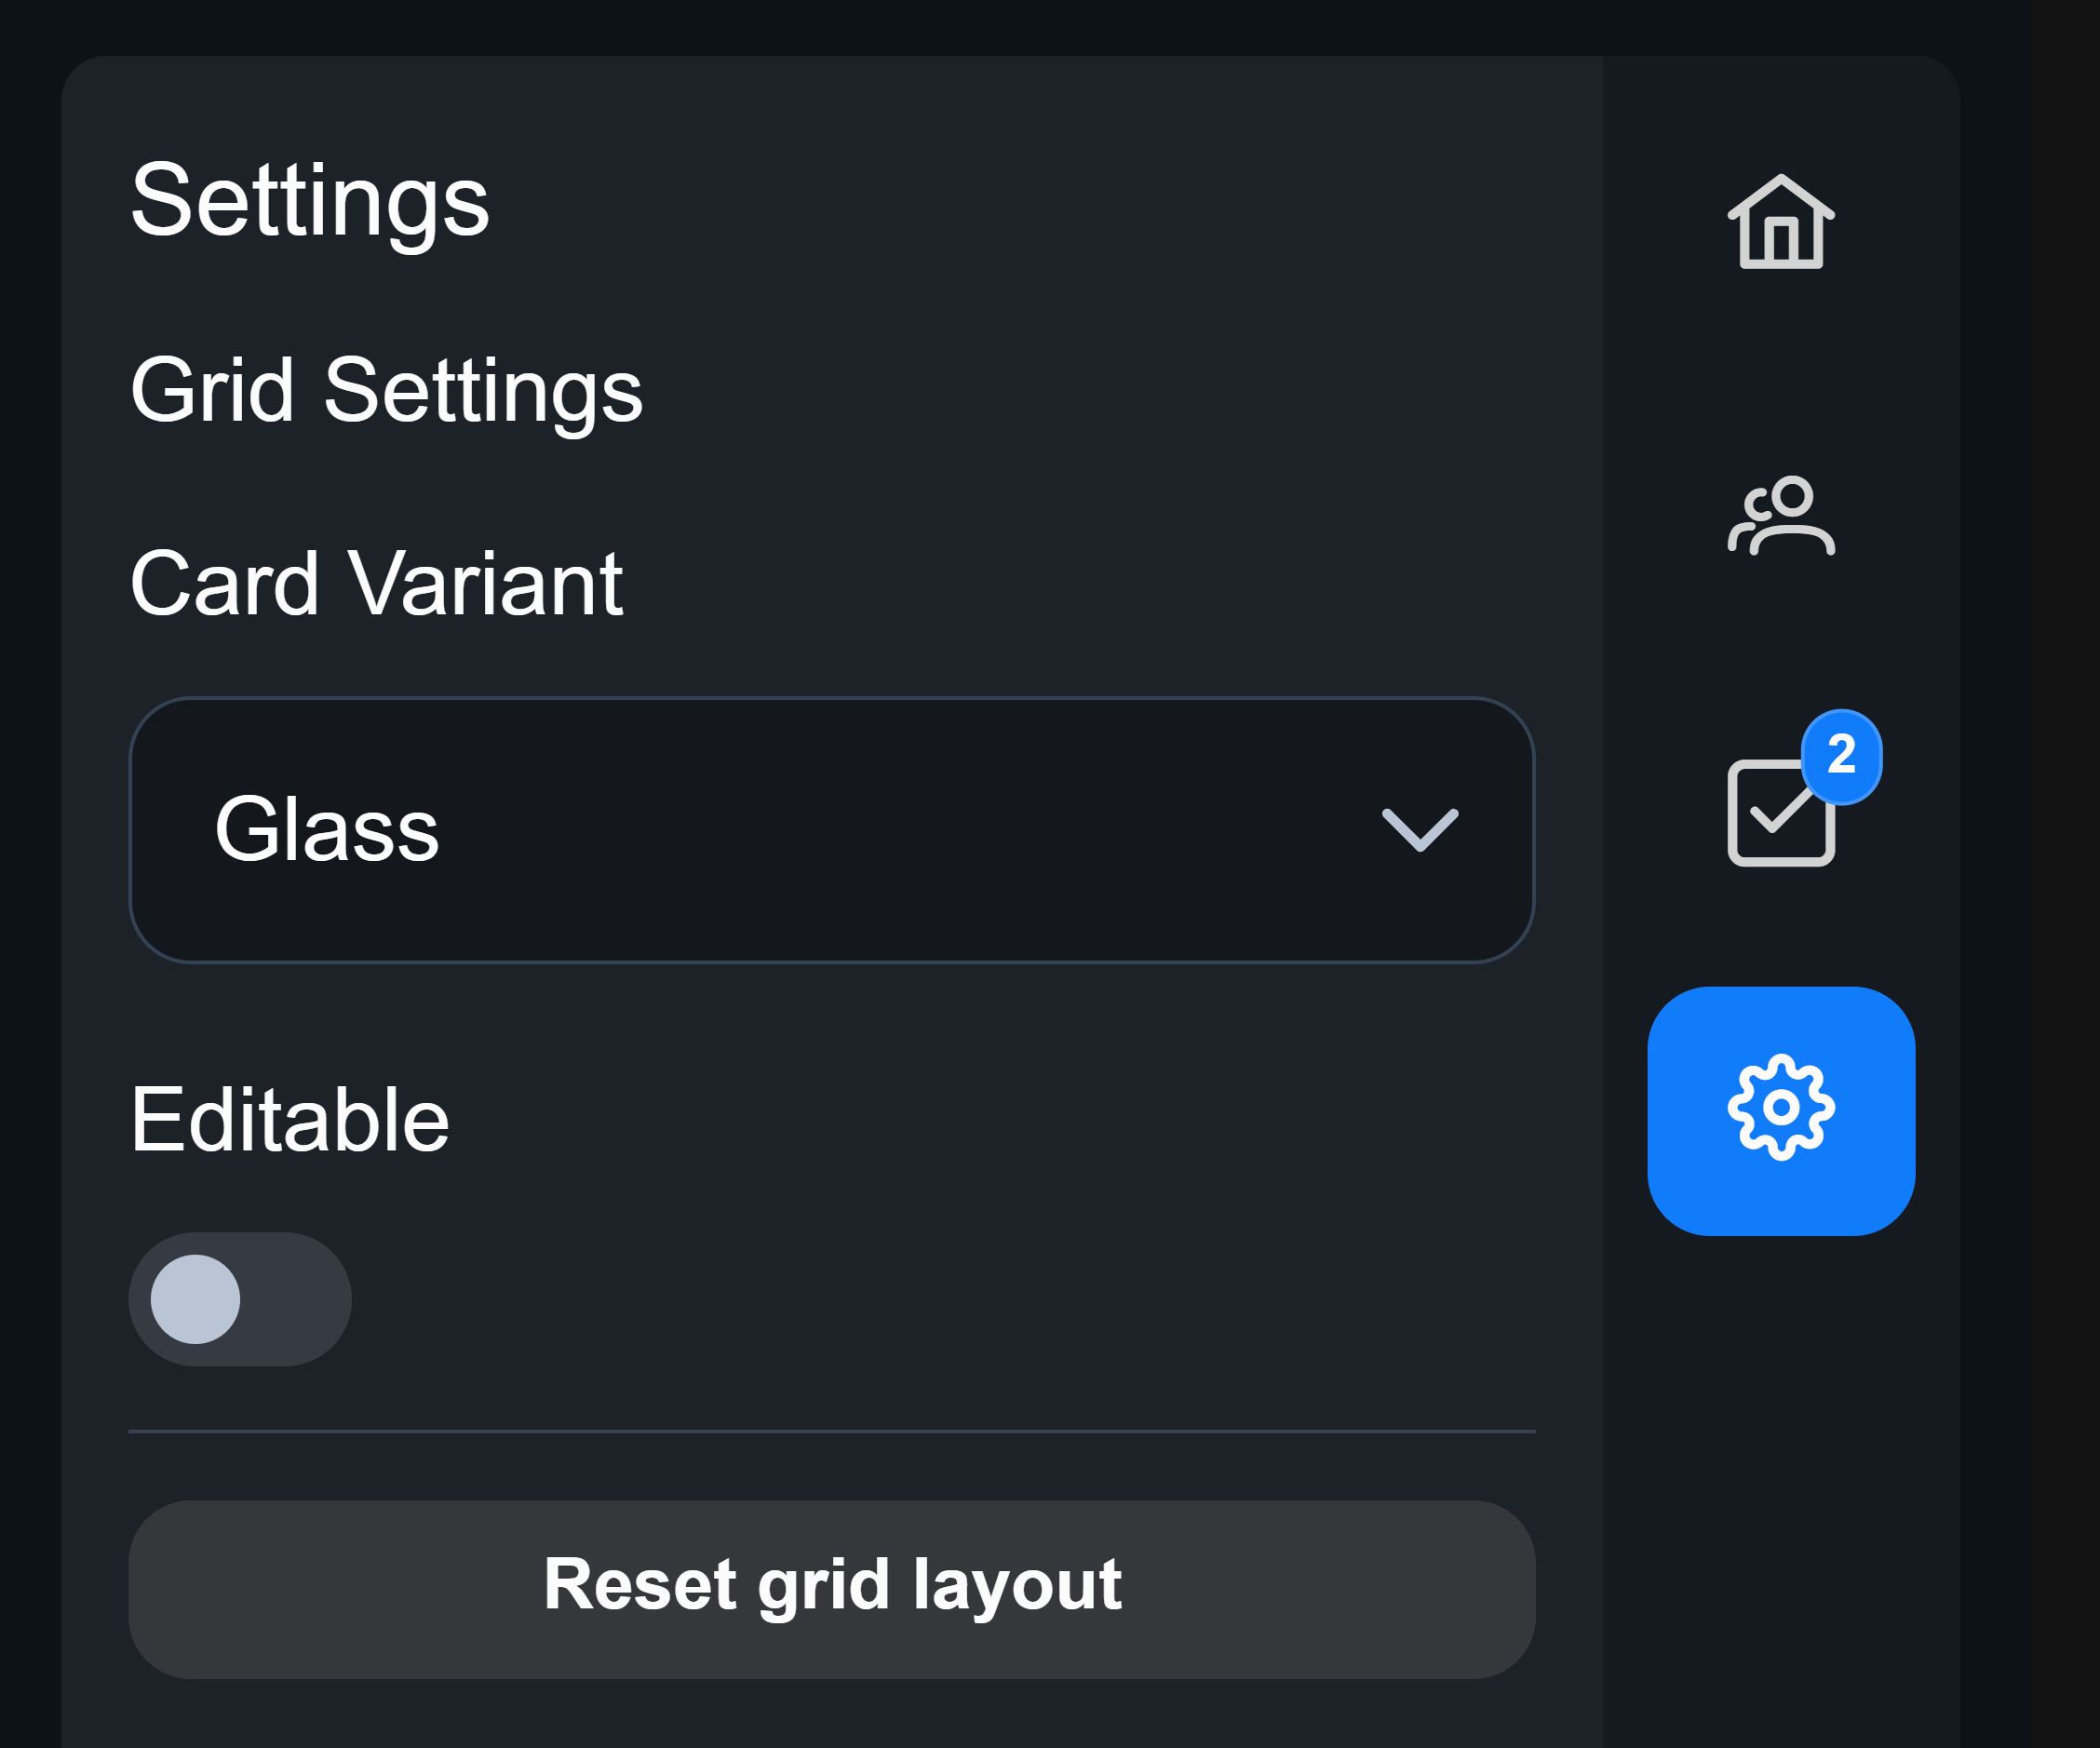
You can adjust the appearance, size and arrangement of your incident dashboard components however you like to create your own workspace. By adjusting the location and size of components with different information, you get the opportunity to tailor the dashboard to your needs, resulting in even easier incident resolution. To do this, simply click the configuration symbol on your right panel and drag a component to your desired size and location.
Incident roles
To further speed up the resolution process you can define incident roles, which will help to distribute tasks among your team members. This feature is restricted to Starter & Pro plans.
Go to Settings → Incident Roles (under Incidents) and change the preset roles or add new ones. Add a meaningful description to the role so that the assignee knows what to do.
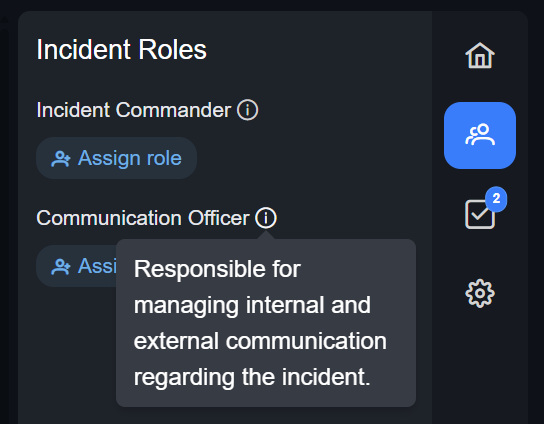
You can assign roles in the incident role menu. Hovering over the info button of a role will give you the description:
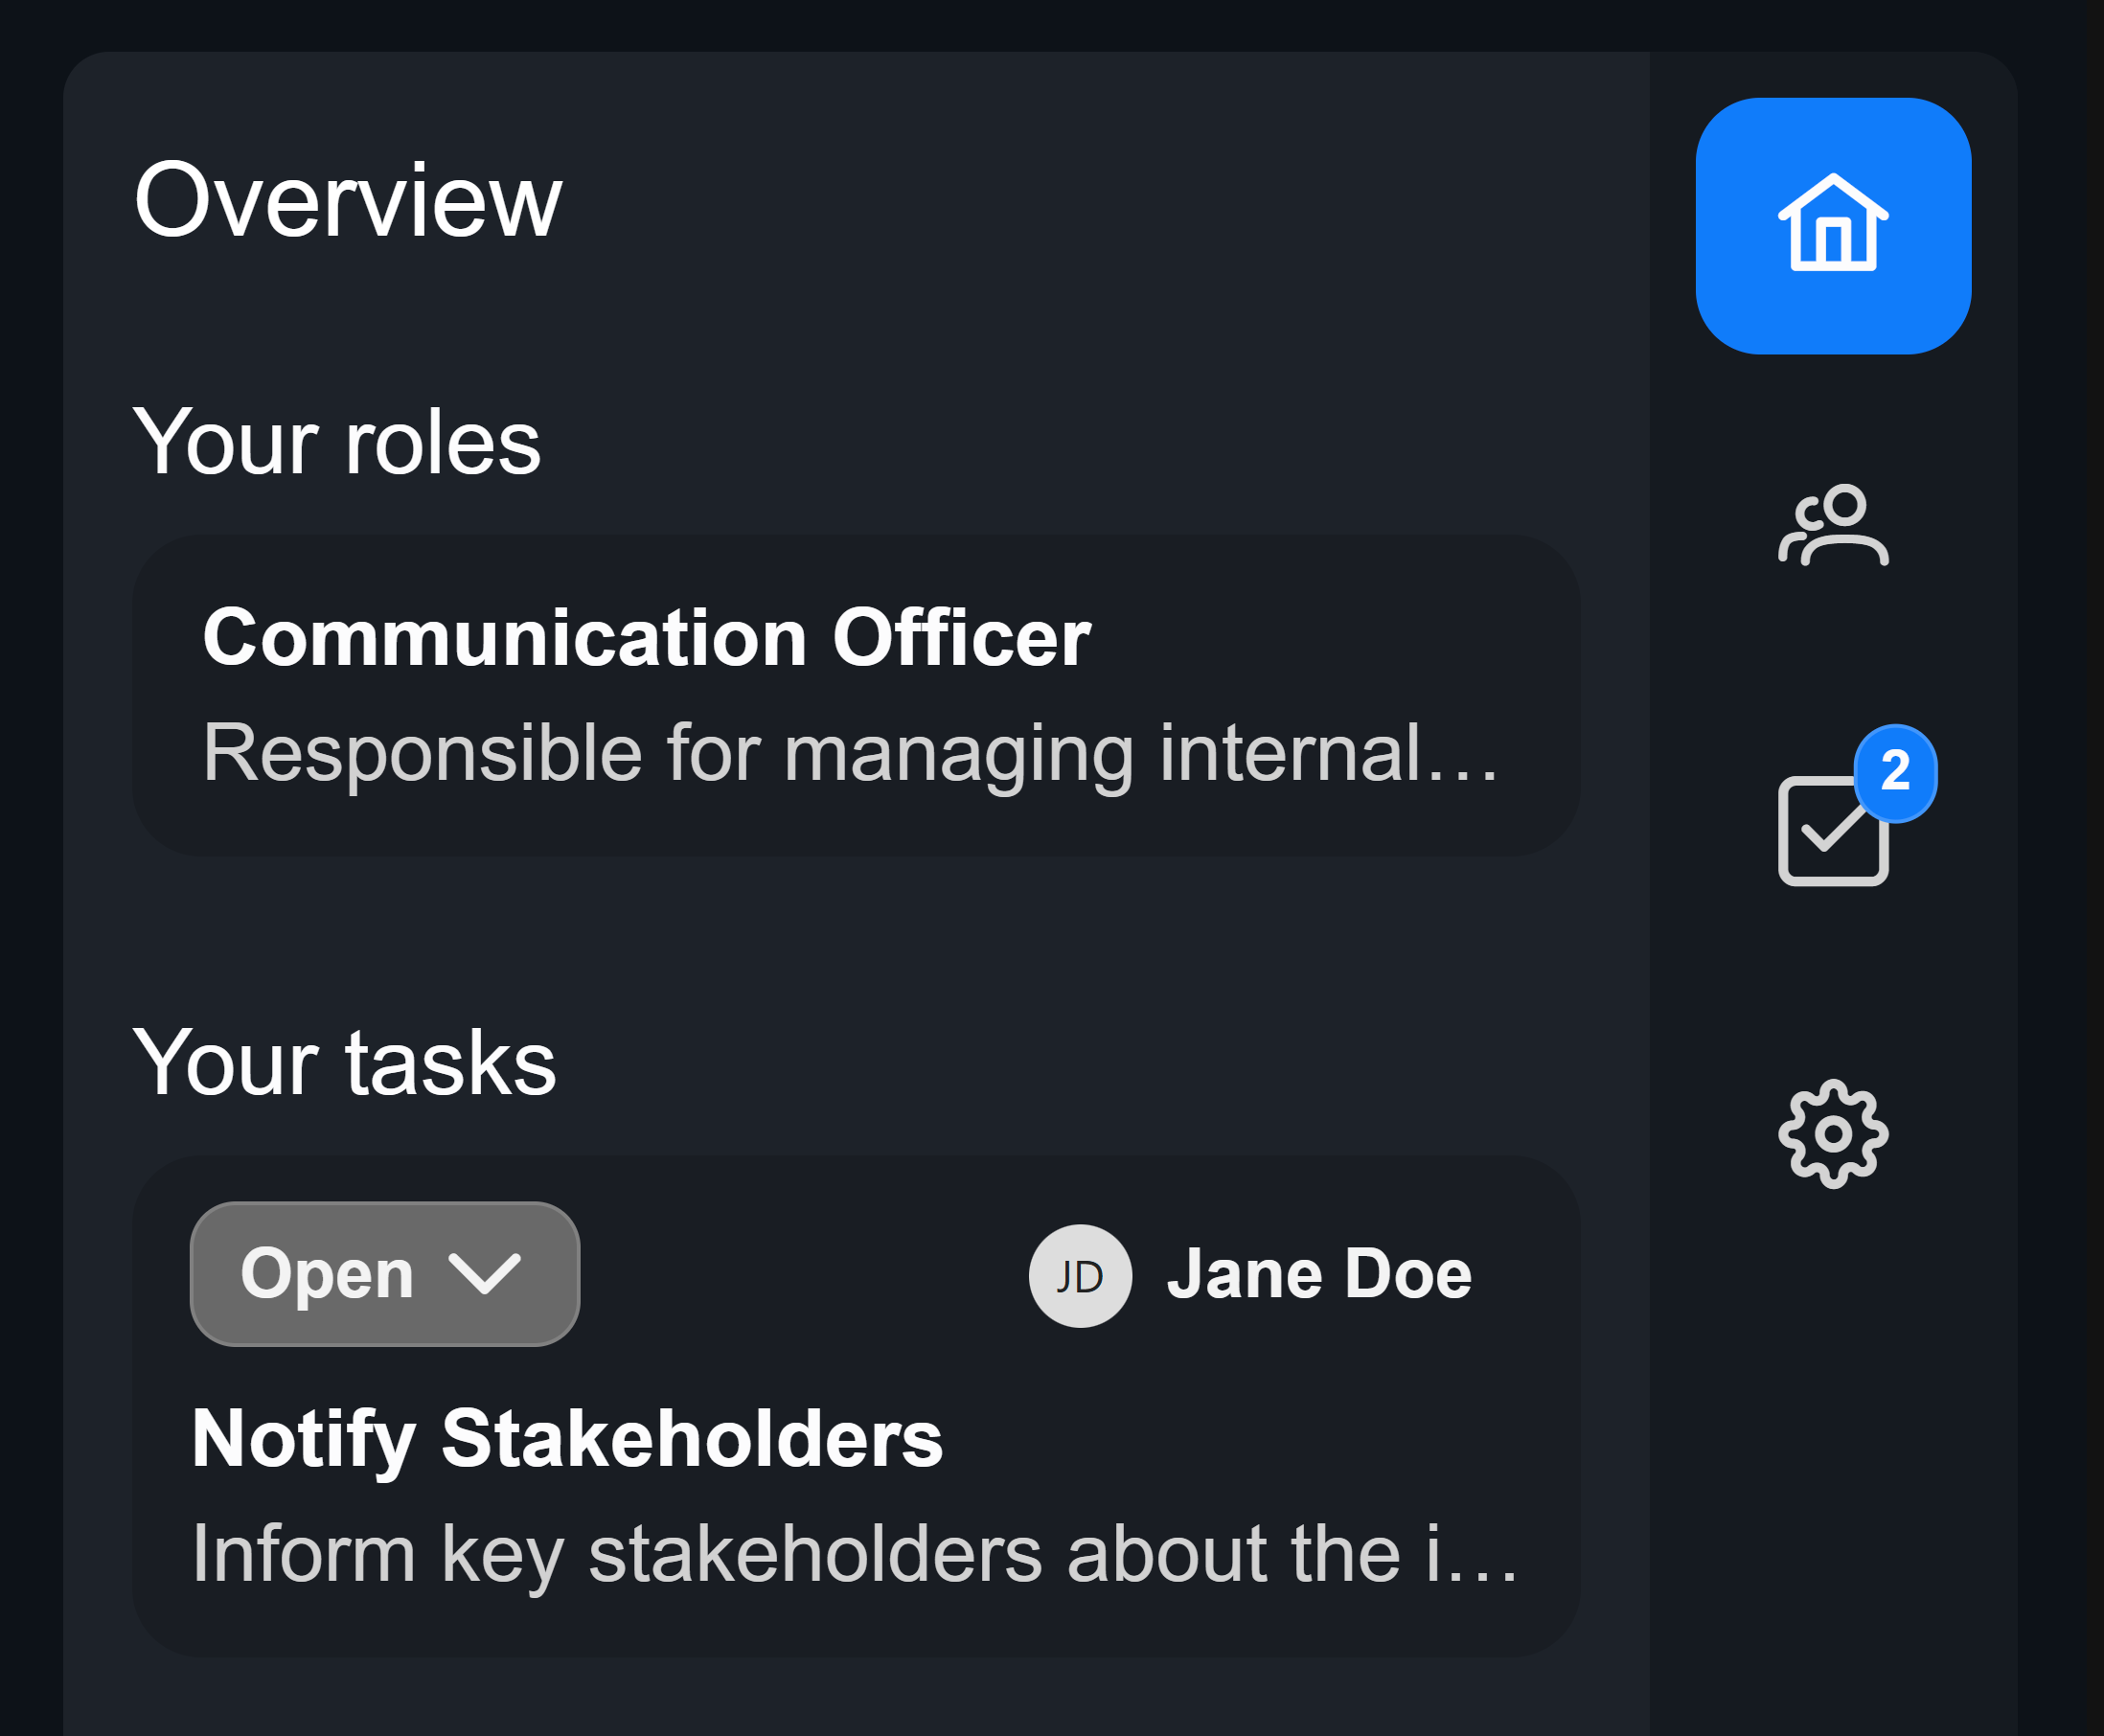
Your incident role as well as your task(s) are shown on the sidebar of your incident dashboard:
Incident tasks
Incident tasks are an even more detailed way of defining responsibilities and tracking the resolution process.
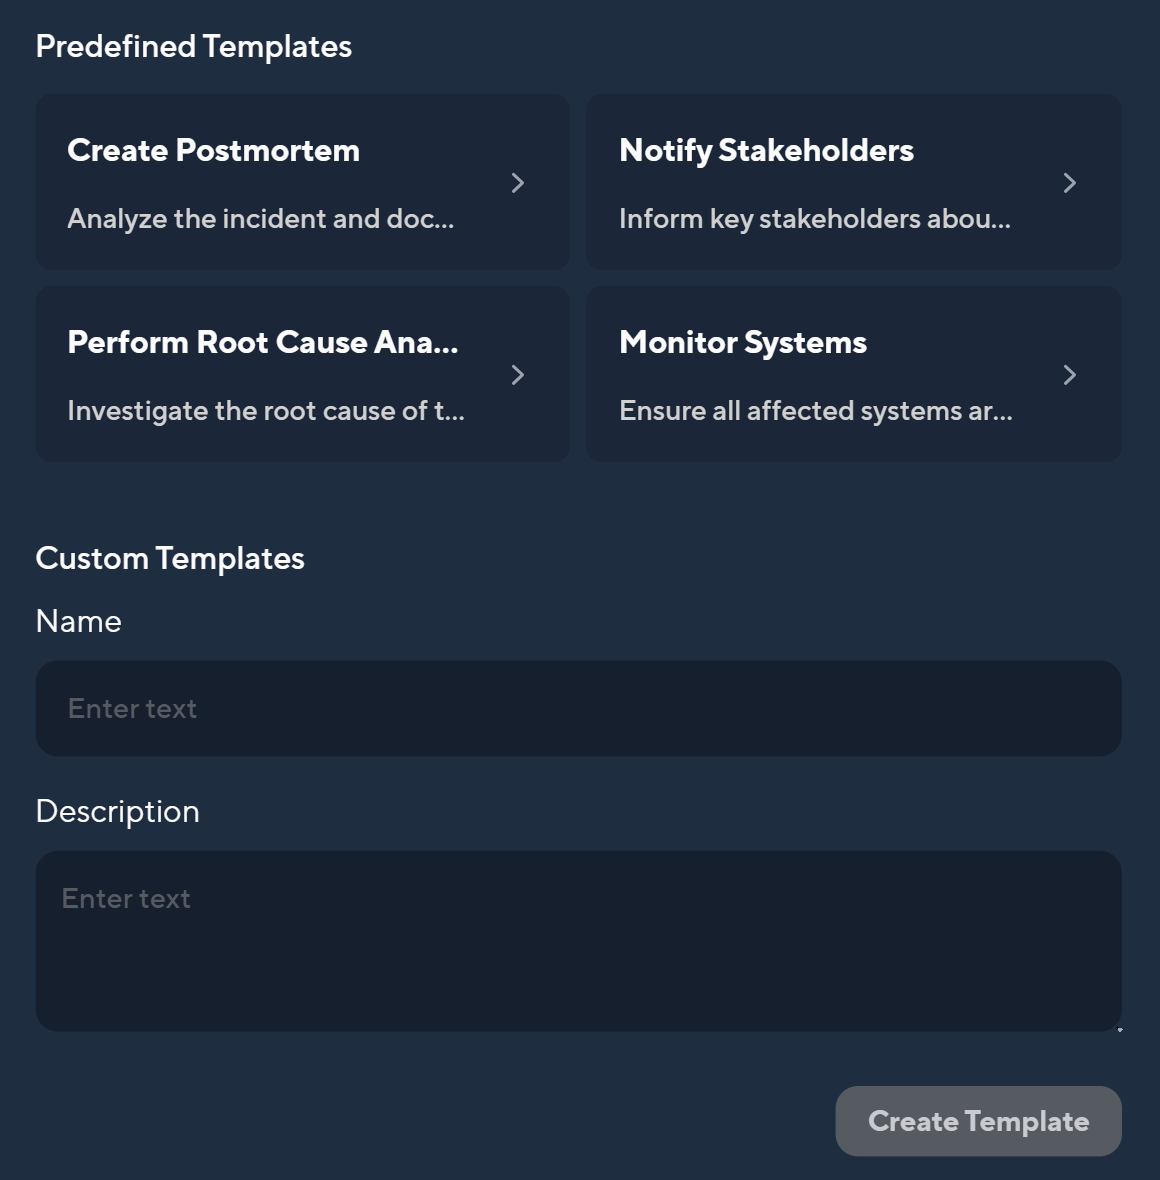
Set up Task Templates under Settings → Incidents → Incident Schemas → Schema of your choice → Create Task Template. You can choose from four common tasks or create one of your own. To do this, simply choose a name and describe the task with as much detail as needed, then click on Create Template.
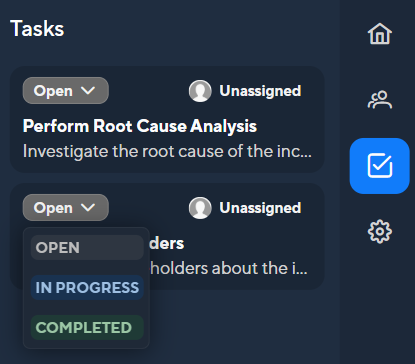
Once you've set up Task Templates, they will appear in every incident/maintenance alert. You can change the status and assignee at any time.
Impacts
When a service is impacted during an incident, you can mark the impact as the following:
- Undetermined
- Partial outage
- Major outage
This impact will be shown on the statuspage as long as you choose to link a statuspage. However, it is possible that components can also fail “completely” without the overall system being noticeably affected. Conversely, a “minor” impact can of course cause a system to fail completely. We have therefore implemented global impacts to decouple these two concepts.
Global Impacts
Whenever the impact on a service and the system itself don't line up, global impacts help to communicate the overall impact more accurately. When a statuspage is linked, you can choose between the following global impacts:
- Undetermined: The impact in unclear.
- Partial outage: The system still has some or most of it's functionality.
- Major outage: The system is down and cannot be used currently.
To save you some time, we also introduced Automatic Global Impacts. Whenever you choose the option Automatic, the impact shown on the statuspage will be the highest impact of your affected services.
Here's an example: If I choose Automatic and all of my affected services have a partial outage or an undetermined impact, the impact will be shown as a partial outage. But if one of my services is currently in a major outage, the automatic classification will be major outage.
Incident query language
Incident Query Language (IQL) allows you to define filters when searching for incidents or to control which incidents and maintenance events are sent through broadcast channels.
You can filter incidents and maintenance events based on the following fields:
Schema
Defines the type of event:
IncidentMaintenance
Priority
Specifies the urgency or classification:
- Incidents:
P1,P2,P3,P4,P5 - Maintenance:
Emergency,Routine,Security
State
The current status of the event:
- Incidents:
New,Acknowledged,Monitoring,Resolved - Maintenance:
Completed,In Progress,Scheduled
Title
Filters by event title:
- Partial match:
"*text*"(e.g.,"*Monitor*"will match any title containing the word "Monitor") - Exact match:
"exact text"(e.g.,"System Maintenance"will match titles that exactly match this string)
AND vs OR:
- Use
ANDto require all conditions (e.g.,priority = P1 AND title = "*Monitor*") - Use
ORto match any condition (e.g.,priority = P5 OR type = Maintenance)
Example Queries
- High-Priority Incident Matching a Title:
type = Incident AND priority = P1 AND title = "*Monitor*" - Maintenance Notifications or Low-Priority Incidents:
type = Maintenance OR priority = P5
Reference: Keys, Values, and Operators
| Field | Possible Values |
|---|---|
| Schema | Incident, Maintenance |
| Priority | Incidents: P1, P2, P3, P4, P5 Maintenance: Emergency, Routine, Security |
| State | Incidents: New, Acknowledged, Monitoring, Resolved Maintenance: Completed, In Progress, Scheduled |
| Title | Wildcard: "*text*","*ends with","begins with*" for partial matches Exact match: "exact text" |
Operators
- Equality:
= - Negation:
!= - Greater/Less Than:
>,< - Wildcard:
*(for partial text matches) - Logical:
AND,OR, parentheses()for grouping conditions
Statistics
Statistics help you to understand how well the response to incidents is working. We currently offer MTTA and MTTR. In your main dashboard you also see resolved incidents and the impact duration of the last 7 days.
MTTA
The Mean Time To Acknowledge (MTTA) reflects how long it takes to acknowledge and react to an incident. Fast and precise communication (e.g. through Broadcast channels) help to reduce the MTTA significantly.
MTTR
The time it takes to resolve an incident is called Mean Time To Resolve (MTTR). A well-structured incident response is often returned in a short MTTR. Incident roles and inbound communication help to drastically reduce the MTTR by improving coordination and aiding the flow of critical information, enabling faster incident resolution.
Monitor statistics
Monitor statistics offer a more detailed insight regarding the response time and availability of your services.