Monitoring
Automate the observation of your services and gain insights into the availability of your applications with our monitors. A monitor can be paused and restarted at any time.
Types of Monitors
We offer different types of monitors to suit various use cases.
HTTP-Monitor
Send HTTP requests to any domain, including your payload and authorization headers, to verify the functionality of your service through an external client.
Parameters
- Method: The HTTP method to use for this request.
- Address: The URL of the service to send the request to.
- Timeout: The number of seconds the monitor should wait to receive a response.
- Valid Status Code: The response code that qualifies this request as successful.
- Headers: Headers to include, such as Bearer Tokens, to authorize the monitor for the request.
Insights
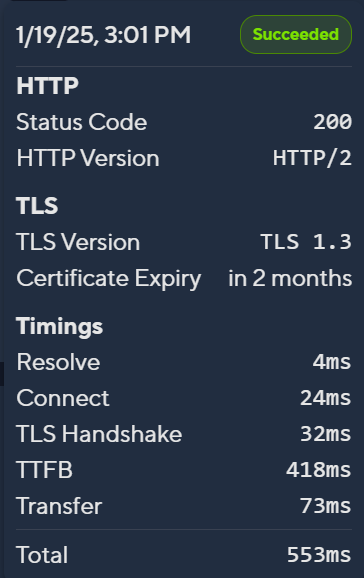
- Certificate Expiration: The expiration date of your domain's certificate.
- TTFB (Time to First Byte): The time taken to receive the first byte.
- Connect: The time taken to initiate the connection.
- Resolve: The time taken by DNS to look up the domain.
- TLS Handshake: The time taken to complete the TLS handshake.
- Transfer: The time taken to transfer the complete payload.
You can view these metrics for the last 20 probes by hovering over the probe boxes.
Ping-Monitor (ICMP)
Check if a server is still available by sending ICMP-Request to the server and receive insights about the latency of your infrastructure.
Parameters
- Address: The IP or domain to ping.
- Timeout: The number of seconds the monitor should wait to receive a response.
Insights
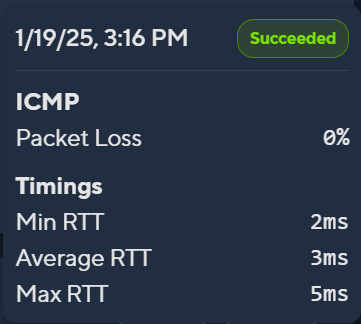
- Packet Loss: The number of packets dropped during the probe.
- Min RTT (Round-Trip Time): The minimum latency for this probe.
- Average RTT (Round-Trip Time): The average latency for the connection.
- Max RTT (Round-Trip Time): The maximum latency for this probe.
These metrics can also be viewed for the last 20 probes by hovering over the probe boxes.
Creating a Monitor
To create a monitor, follow these steps:
- Navigate to Monitors in the left sidebar.
- Click on Create Monitor.
- Configure your monitor as needed.
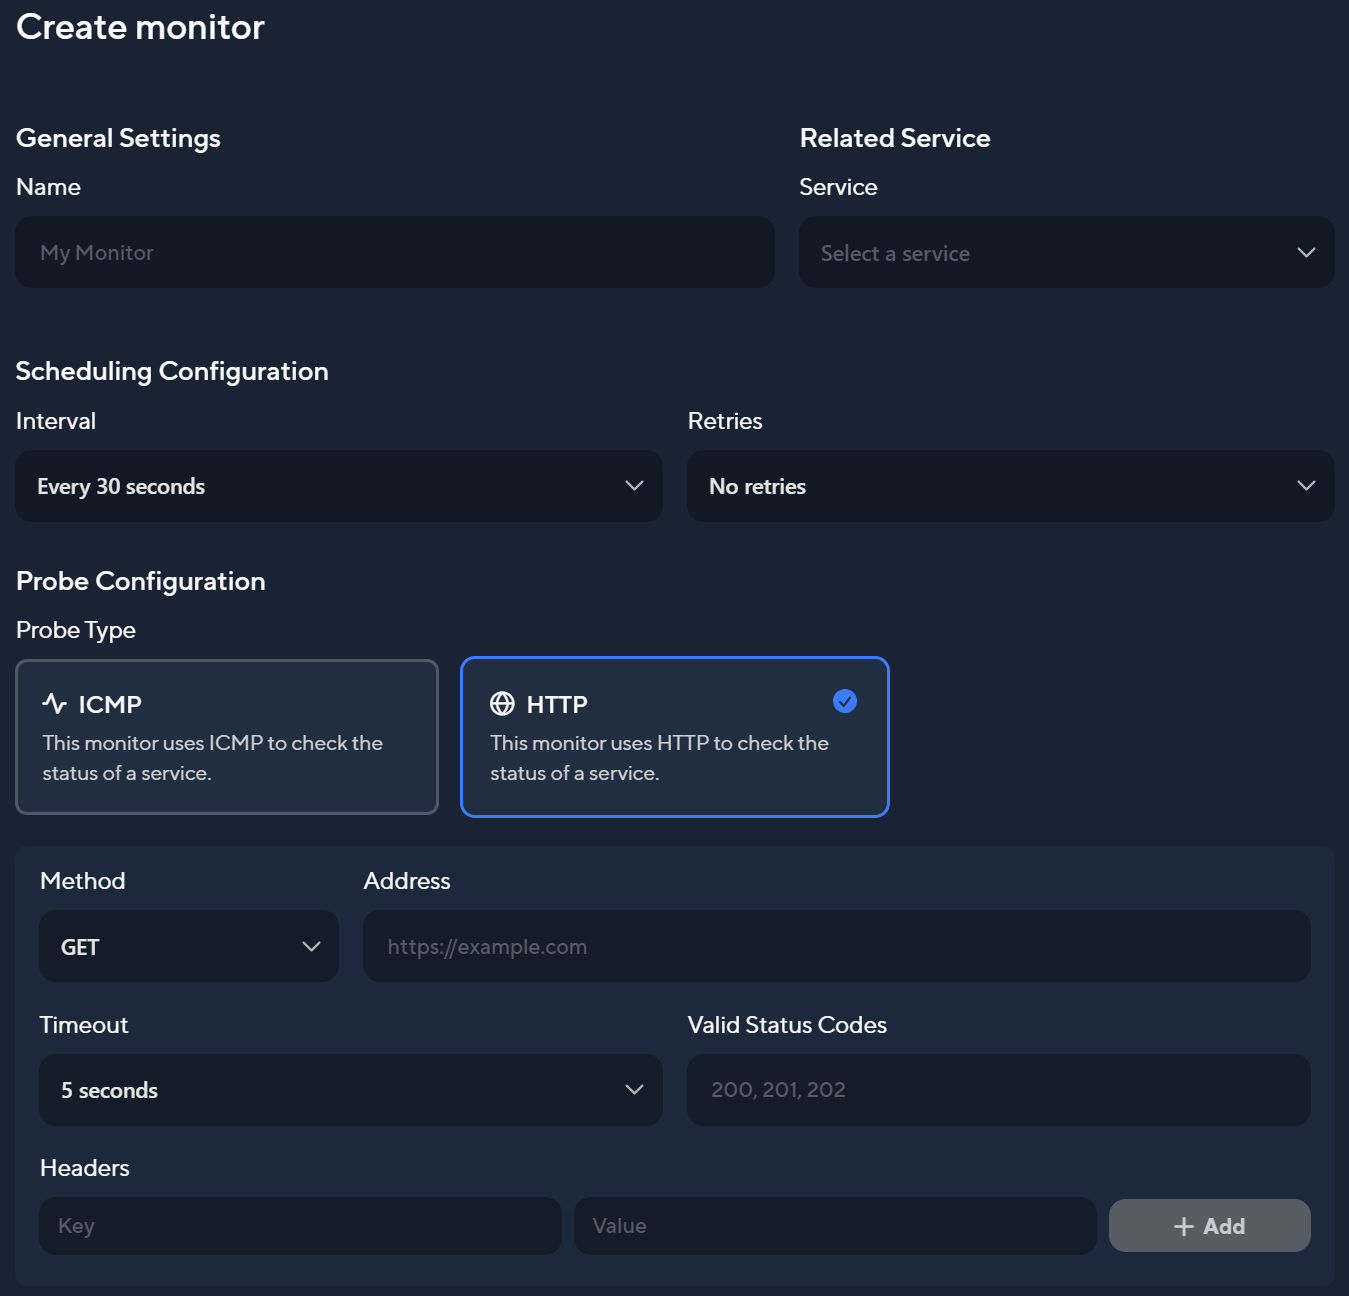
The ICMP method will only need an address and timeout to be configured.
Important: Every monitor needs to correspond to a service. If you don't create a service first, monitor creation is also not possible!
Monitor Settings
- Service: Select the service that corresponds to the monitor. This is required to create alerts for the correct service.
- Interval: Set the interval at which the monitor will be executed.
- Retries: Specify how many times the monitor should retry if it fails before it is marked as failed.
Statistics
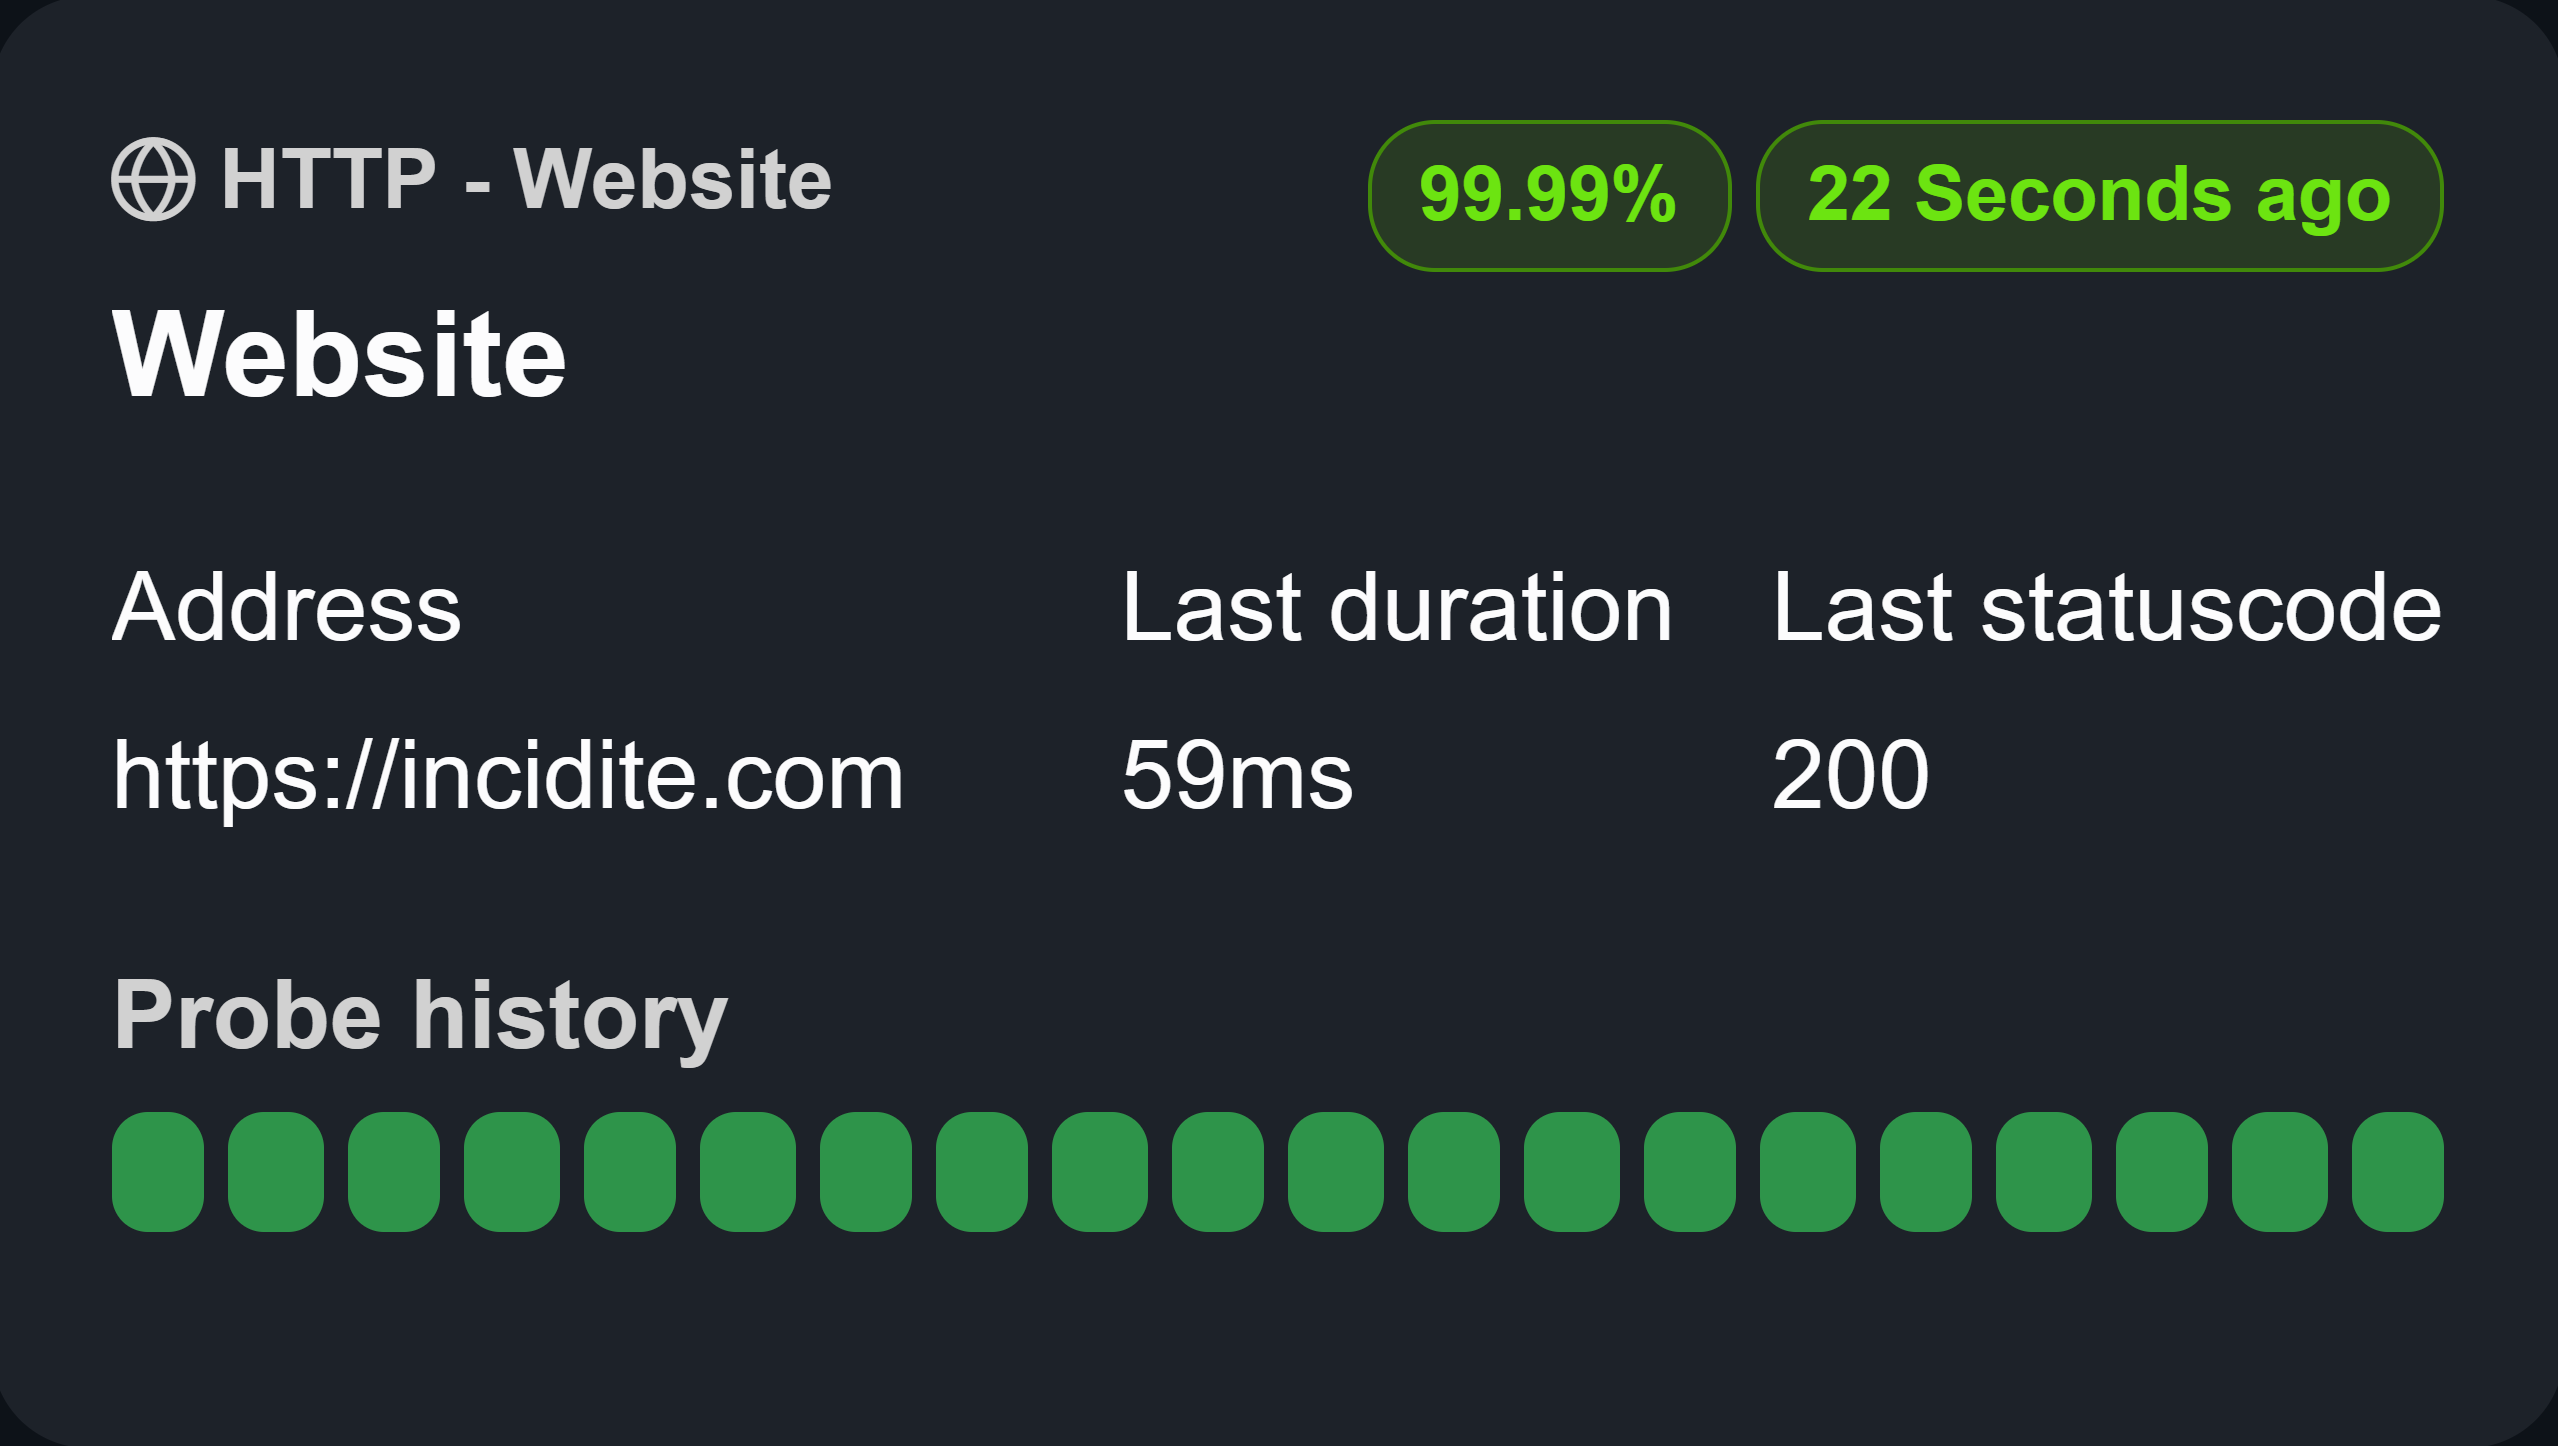
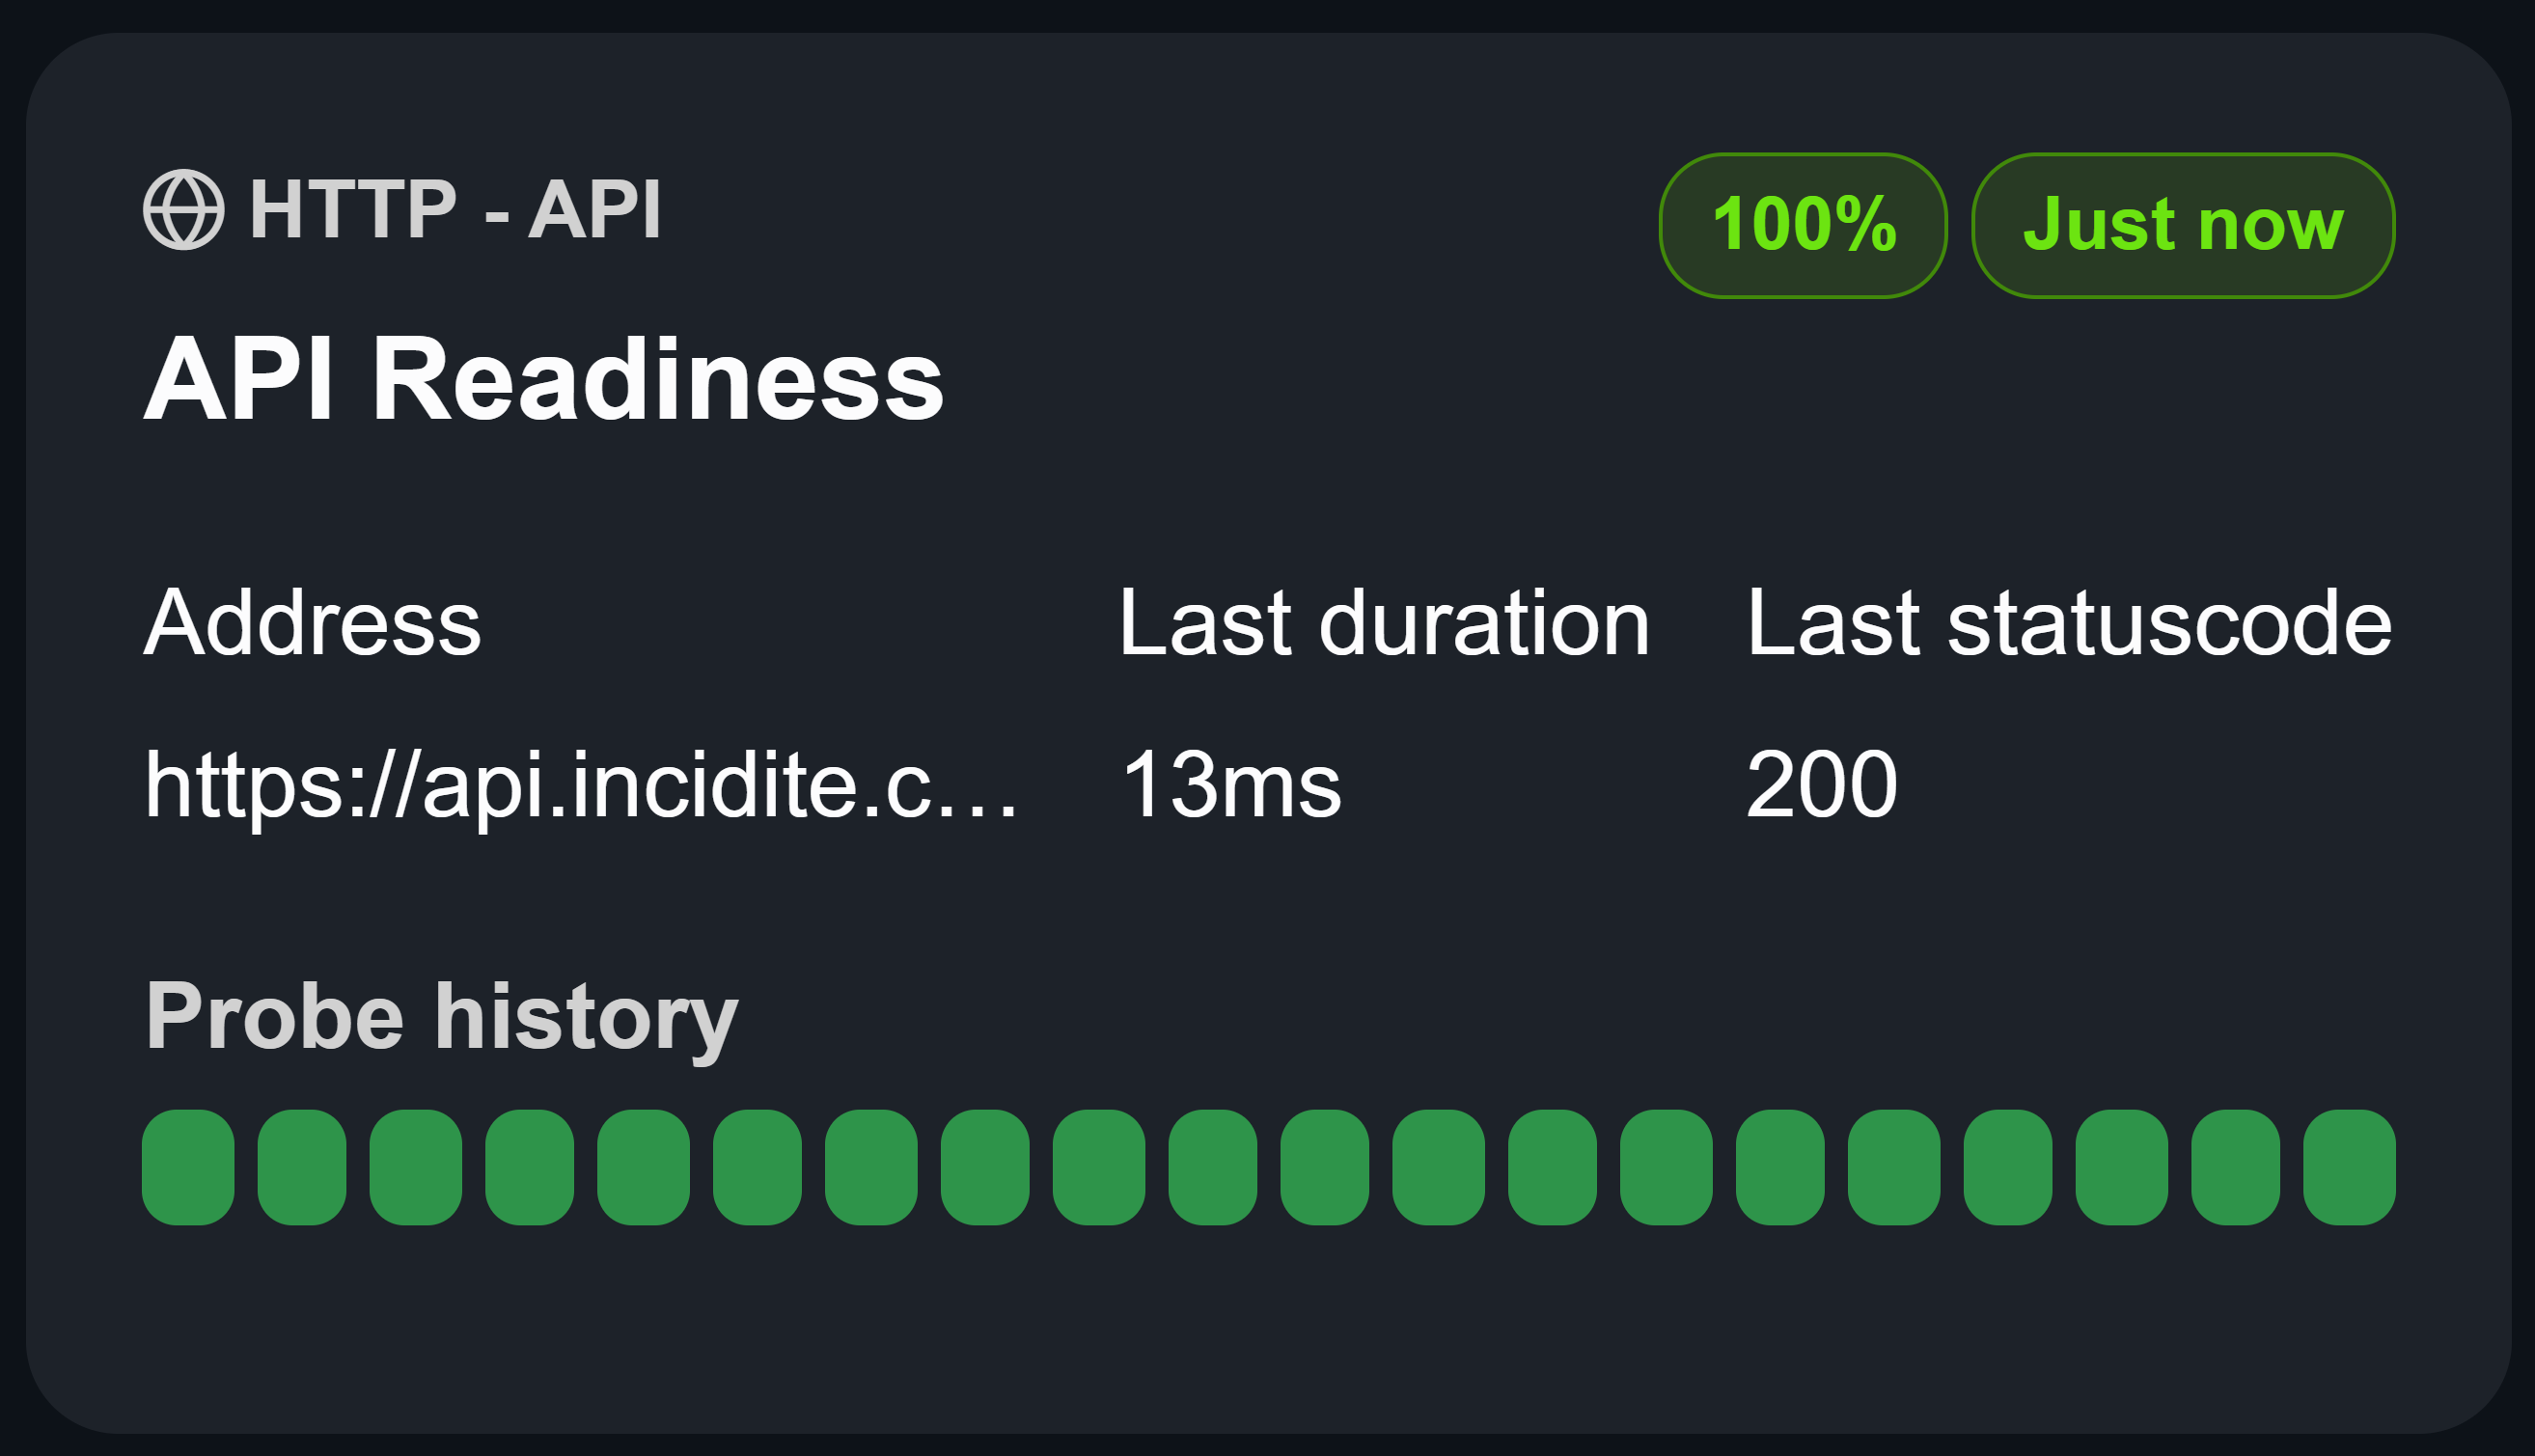
To better understand the performance and availability of your services, we offer a variety of monitor statistics. The availability and probe duration are displayed in your monitor overview, which looks like this:
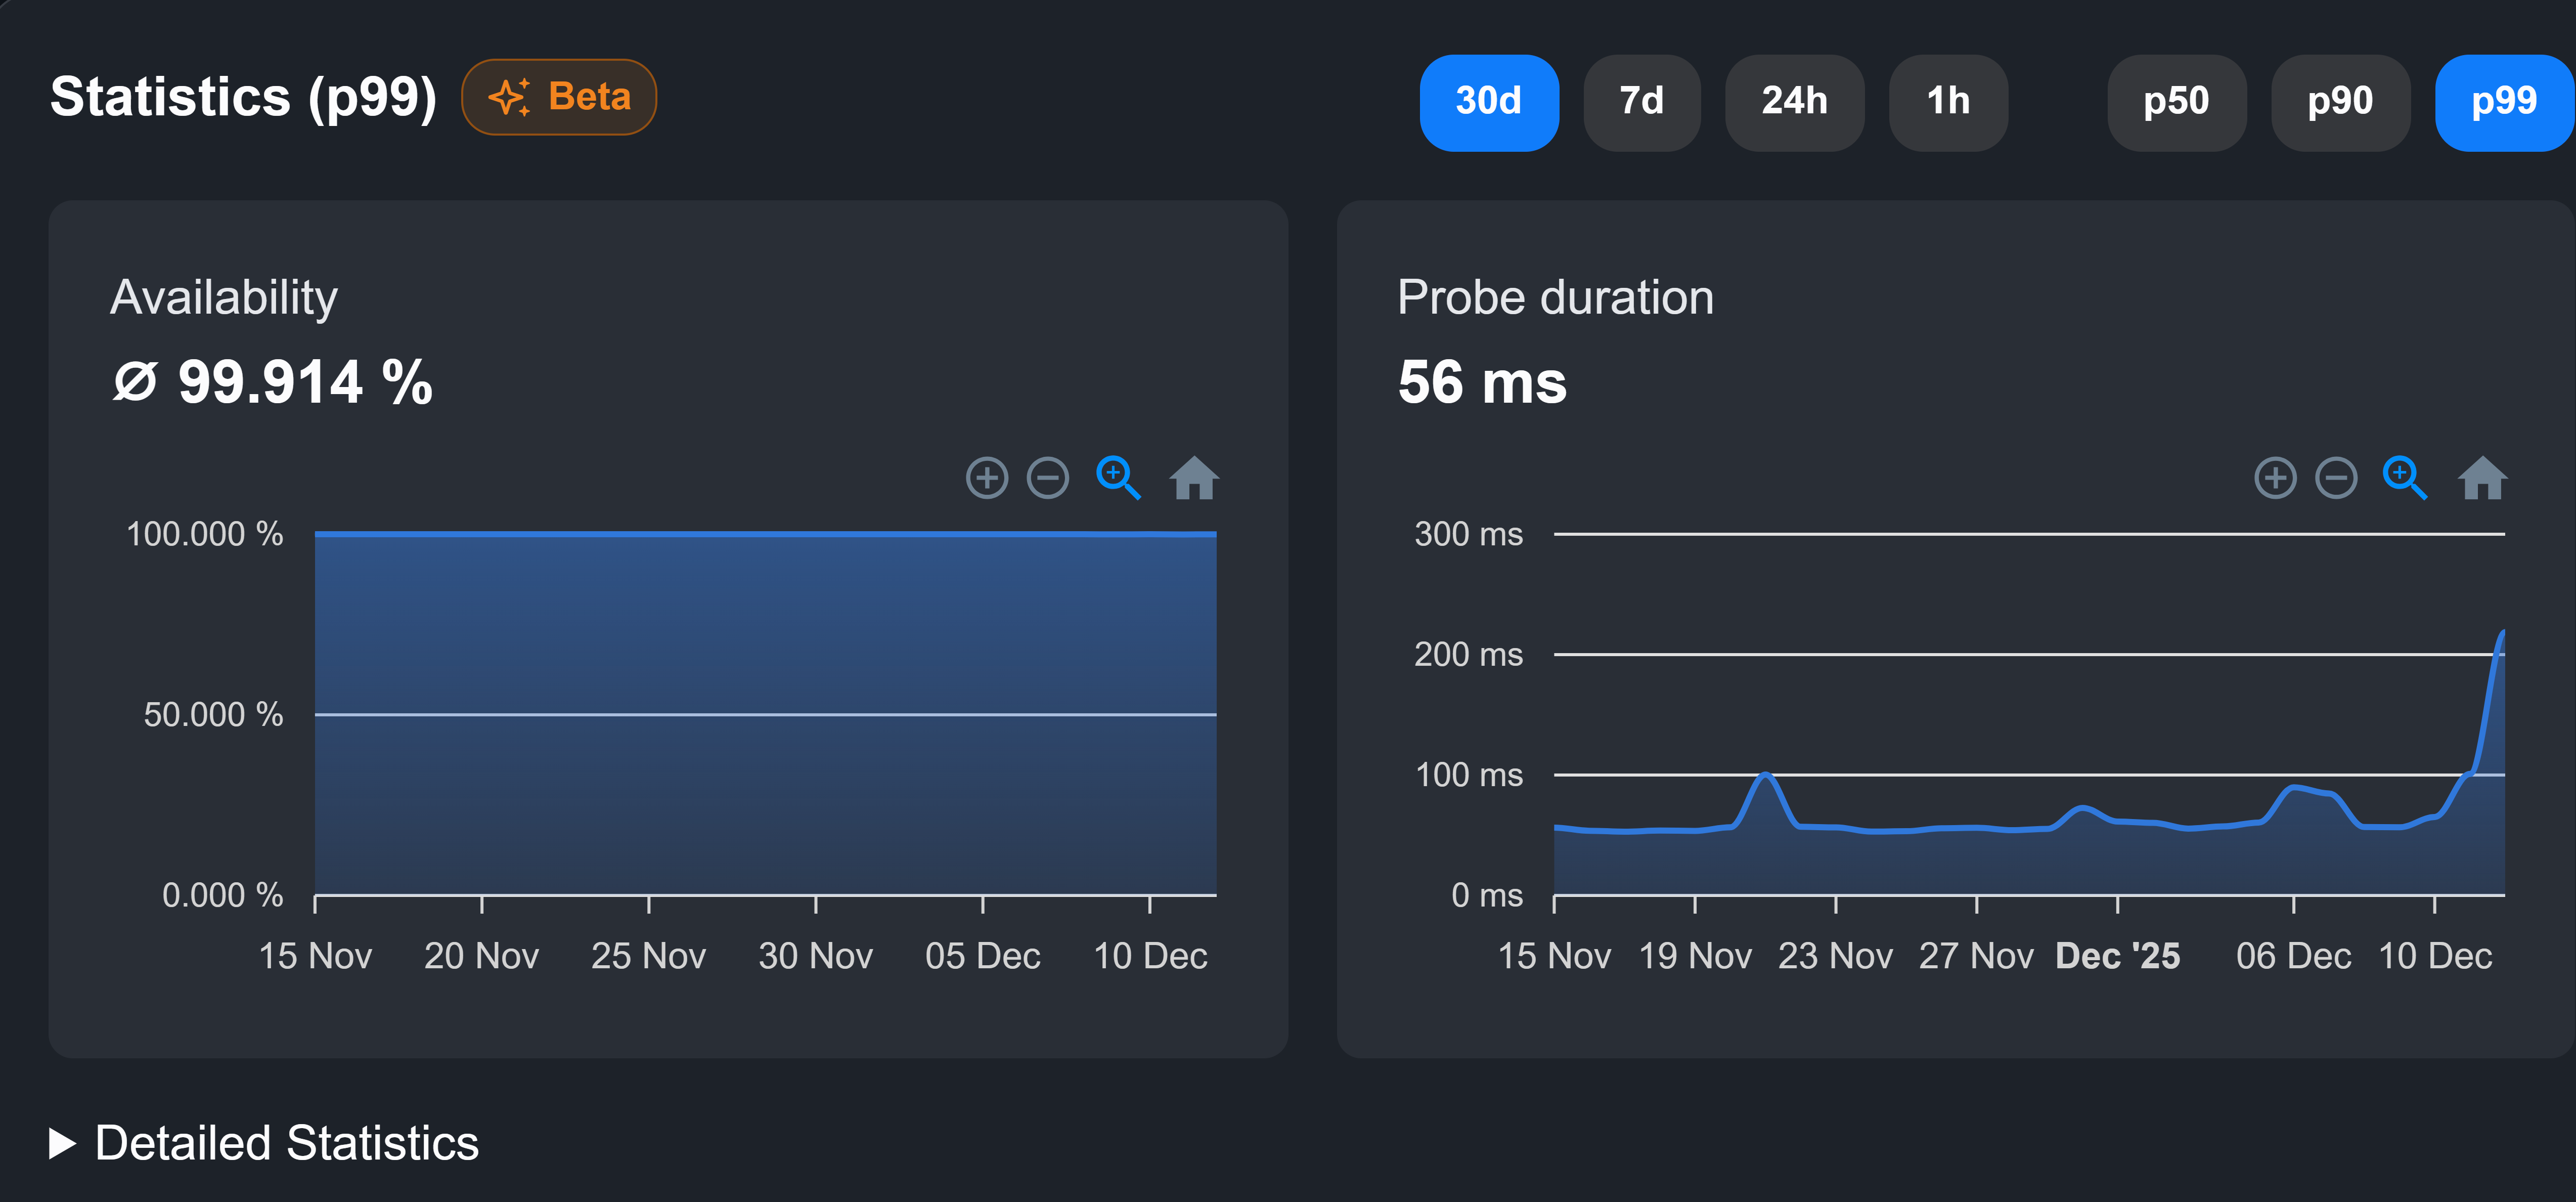
You can narrow down the timeframe of your data by scrolling while hovering over the graph. Under "Detailed Statistics" you will find the following metrics:
HTTP statistics
-
Availability represents the time that customers can fully access the service.
-
Probe duration is the total time from request inititation to the last byte of response.
→ often used to understand the end-to-end performance of the monitored system
-
Resolve measures the time required for a DNS resolution.
→ indication for the DNS resolution performance
-
Connect is the time it takes to build a TCP connection after a DNS resolution.
→ indicates network latency and the server’s ability to accept connections
-
TLS Handshake defines the required time for the negotiation and establishment of a secure SSL/TLS client-server connection.
→ shows the overhead of setting up encryption
-
Time to first byte is the total time from request initiation to the first byte of response.
→ helps in assessing the server's responsiveness
-
Transfer marks the time it takes from the first byte of the response to receiving the full response.
→ measures the download speed of the content from the server after the connection has been established
ICMP statistics
Since ICMP ist a much simpler monitor method, the data derived from a probe can be visualised in just two metrics:
-
Availability and
-
Average RTT measures the average time it takes for a data package to travel from a source (like a client or monitoring probe) to a destination server and back.
→ captures the delay in the network between sending a request and receiving a response
Percentiles and timespans
For a further analysis of each of these metrics, p50, p90 and p99 can be used. They're statistical measures used to understand the distribution and reliability of data, especially in performance monitoring.
-
p50 (50th Percentile): Also known as the median, p50 indicates the middle value of a data set. For example, in response time data, P50 tells you the point at which 50% of requests are faster and 50% are slower. It represents an average experience for users.
-
p90 (90th Percentile): This value shows that 90% of requests are faster than this threshold, while the other 10% are slower. It focuses on the upper end of typical performance, indicating what most users experience in nearly all cases.
-
p99 (99th Percentile): In this case, 99% of requests are faster, and only the slowest 1% are slower. It’s useful for identifying outliers or worst-case scenarios, such as occasional high response times.
To get a better scope of your service's perfomance, every metric can be viewed for the last hour, day, week and month.