Monitoring
Creating a monitor
General Settings
Under Monitors → Create Monitor you will find the following mask:
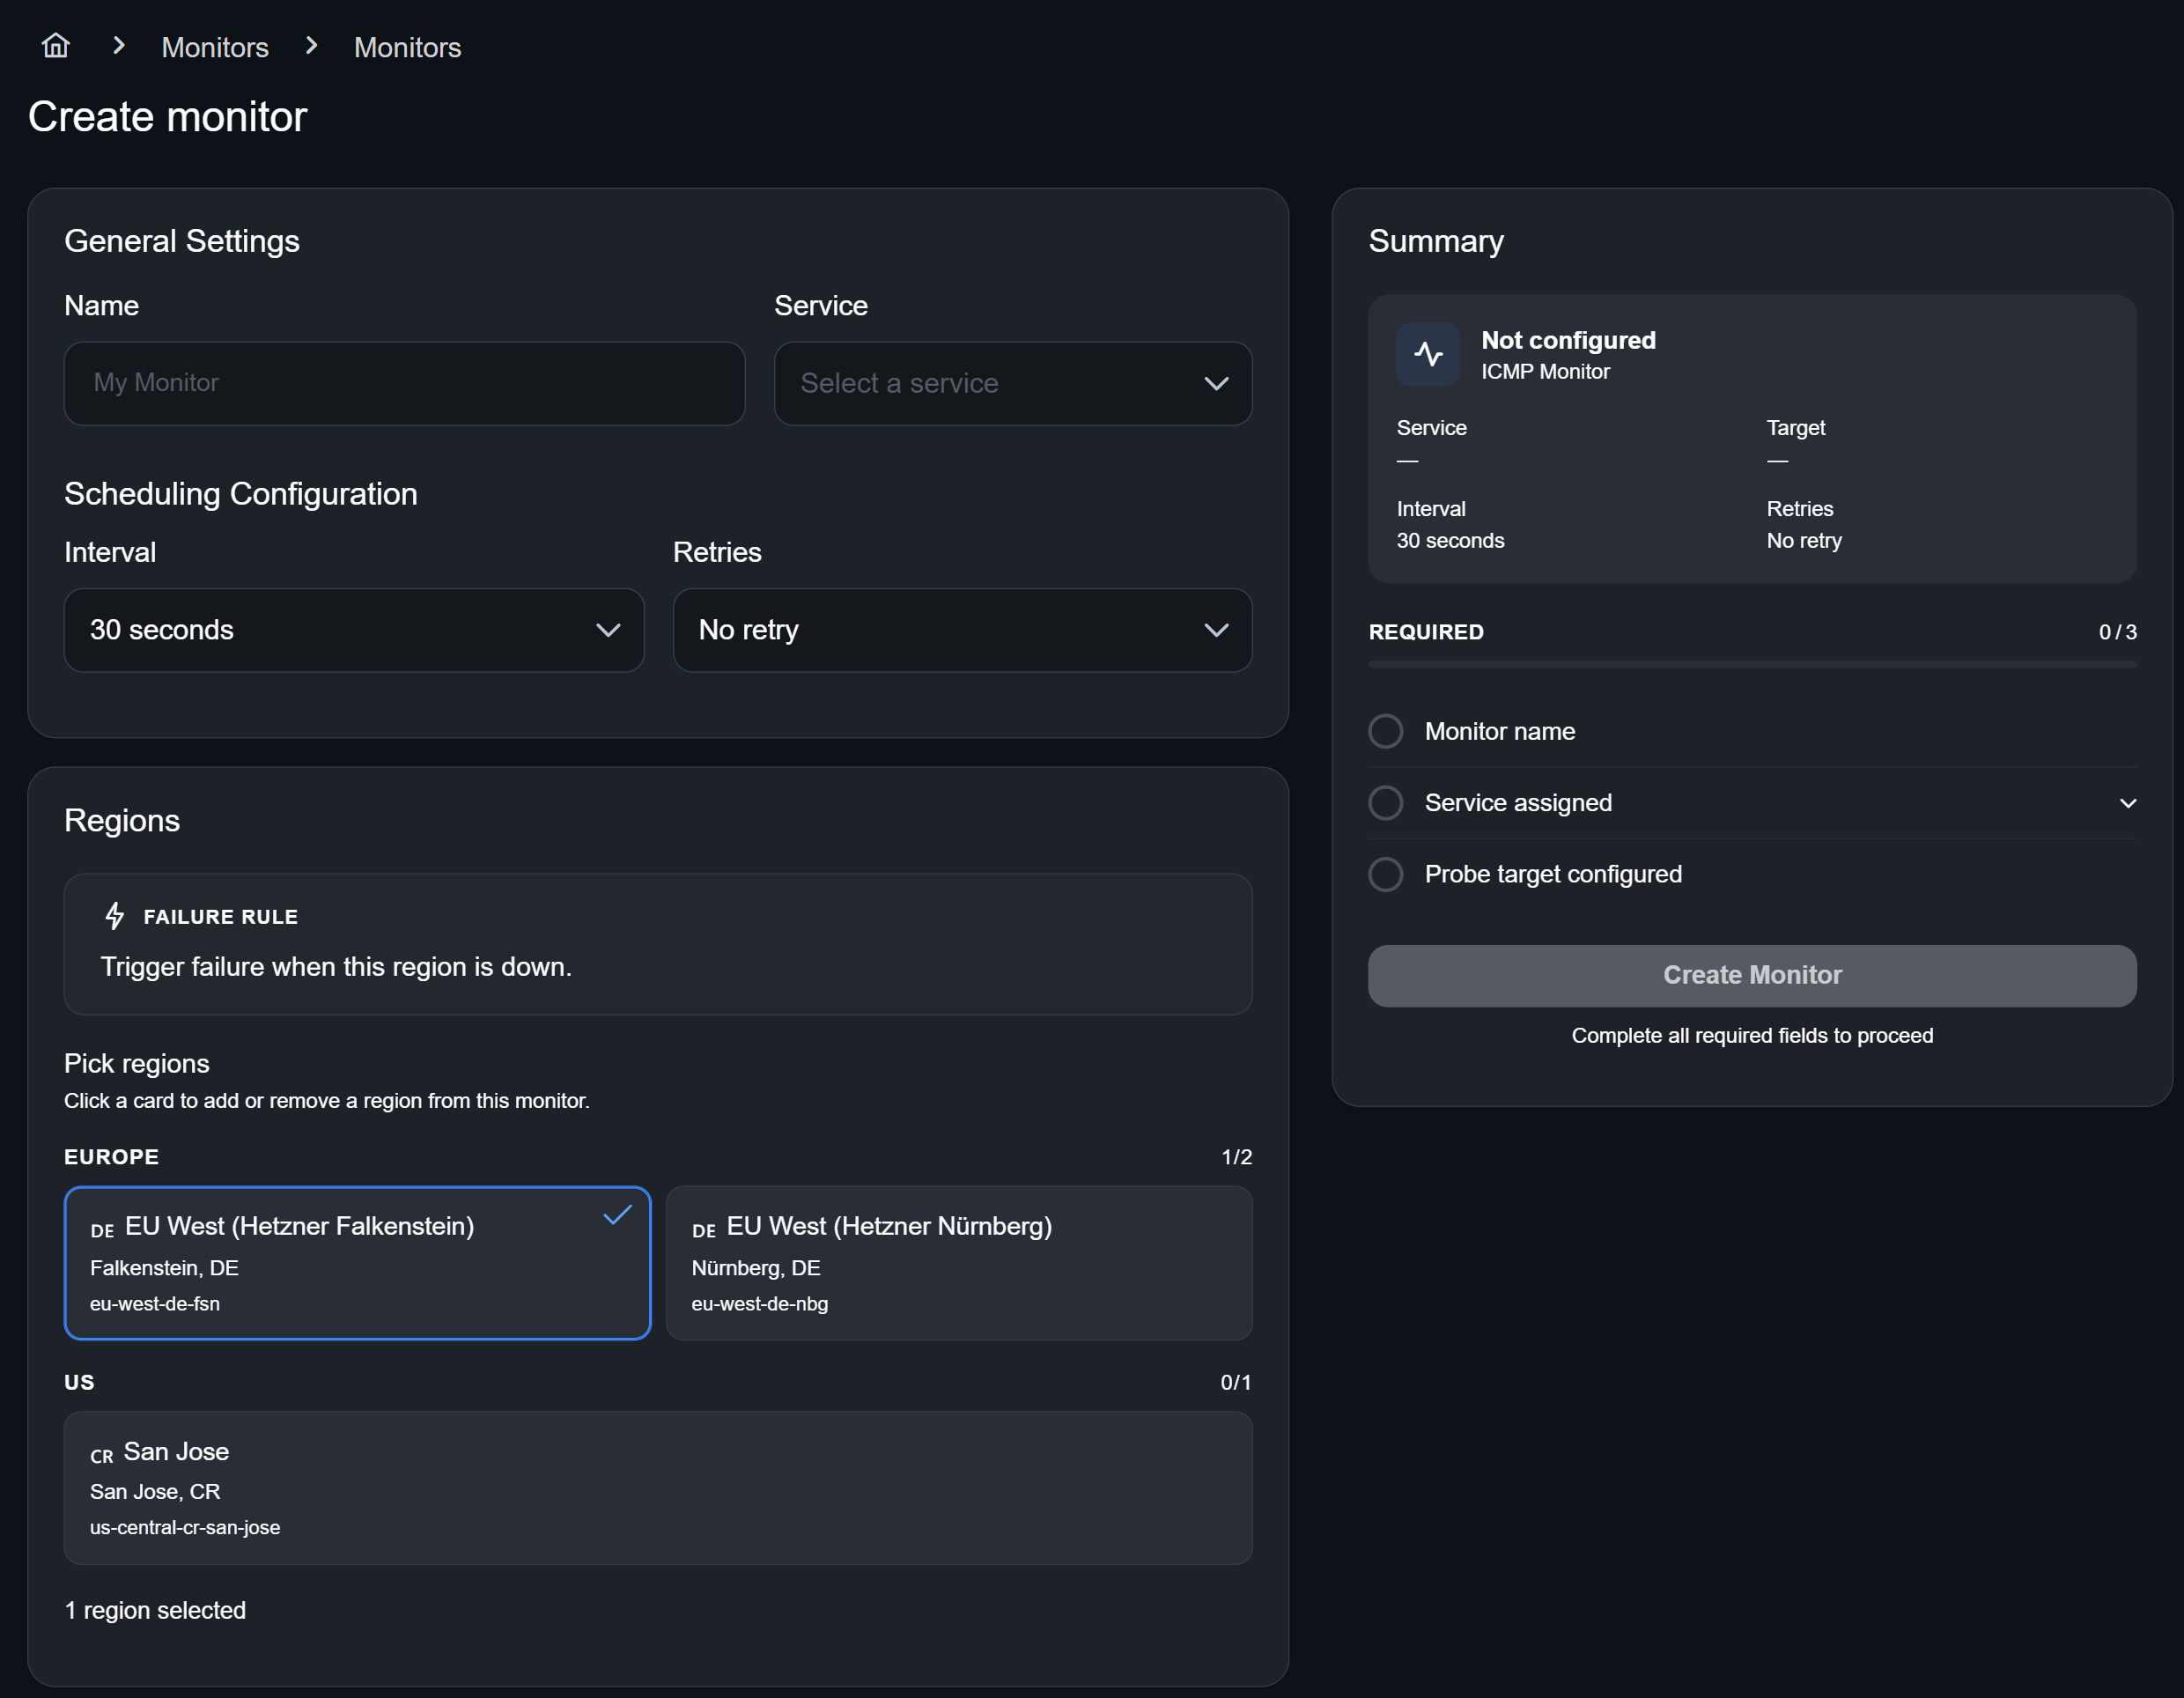
First, give the new monitor a name and link the service you want to monitor. Next, set the interval at which the monitor should check your service. Under Retries, specify how many times a check can fail before an alert is triggered.
Multiregion monitoring
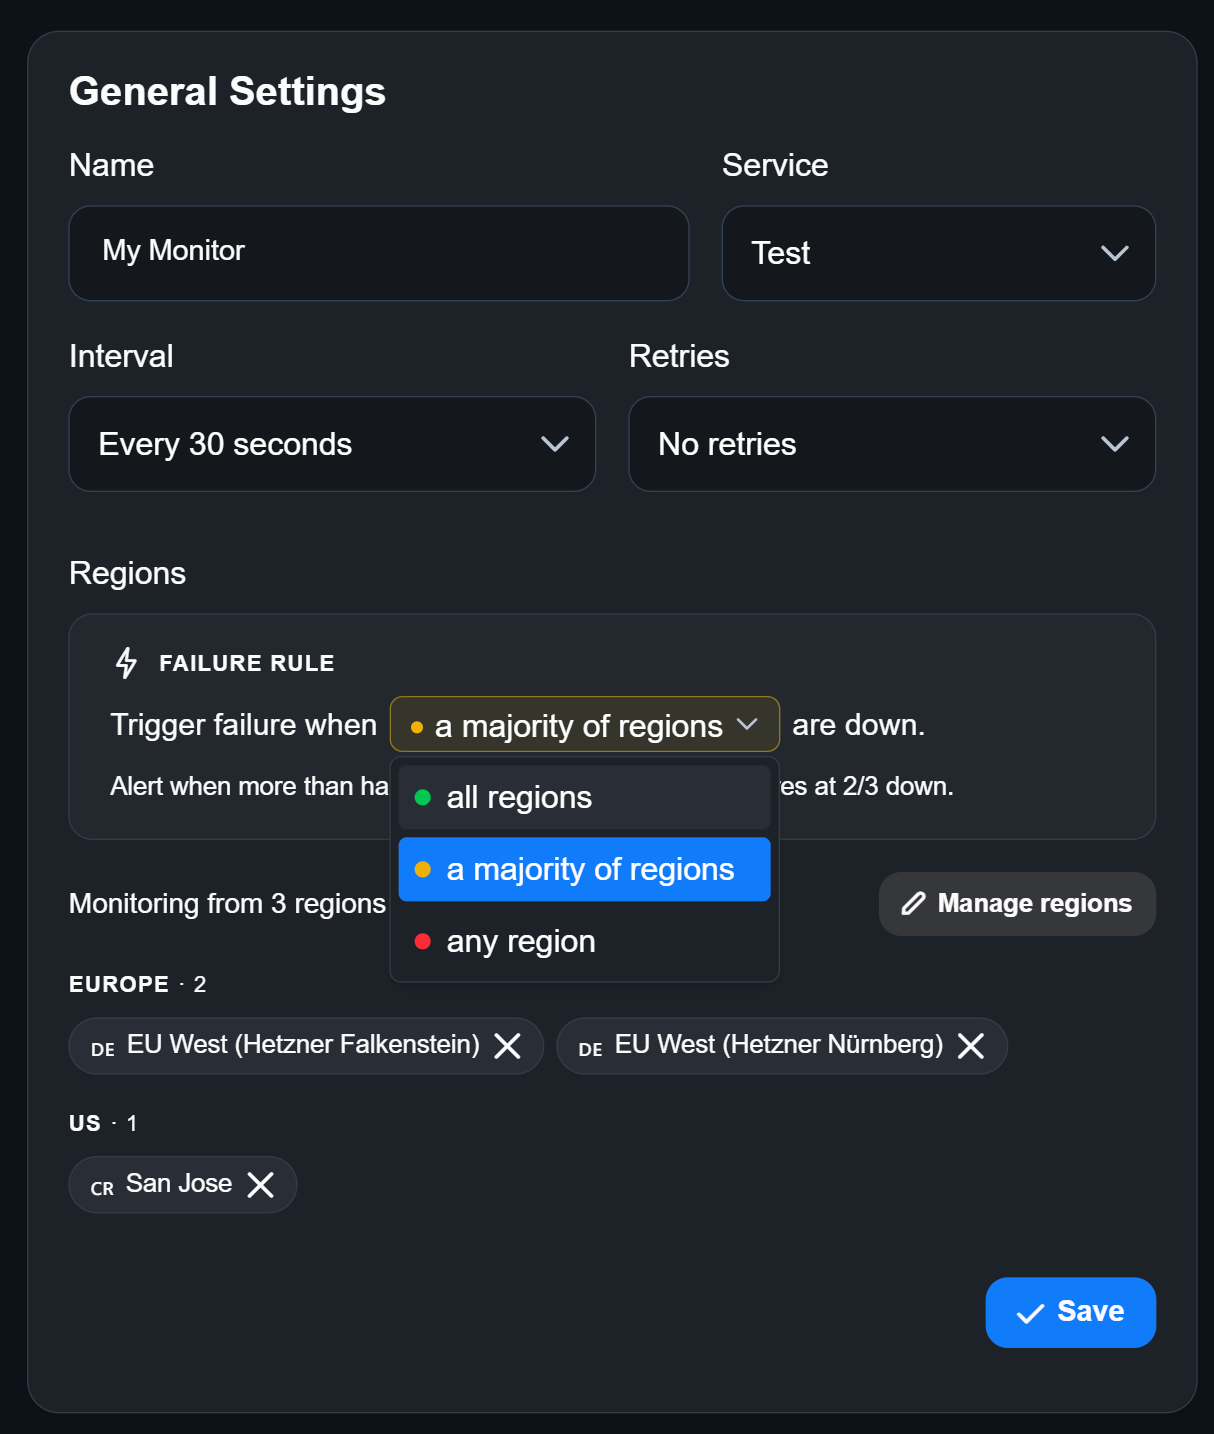
Under Regions, you can choose up to three locations to monitor your target independently. Additionally, you choose the amount of regions that have to fail in order to trigger an alert:
- all regions: Every region has to be down before an alert is triggered.
- a majority of regions: More than half of the regions have to fail.
- any region: One region is enough to trigger an alert.
Probe configuration
Scroll further down to find the Probe Configuration. Choose between an ICMP/Ping and HTTP monitor. You only need an address and timeout to configure an ICMP monitor. An HTTP monitor will also need a Method:
- GET: Retrieves the URI (Uniform Resource Identifier) of the target
- POST: Sends data to a server to create a new resource or perform an action.
- PUT: Updates the target or creates content within it
- DELETE: Removes the target
- PATCH: Makes partial changes to the target
- HEAD: Unlike GET, retrieves only the headers of the target; the body is not included
- OPTIONS: Returns the available HTTP methods and other options for the target to determine its capabilities
Adding Valid Status Codes and Headers is optional.
How to change settings
You can change any parameter of your monitor under Monitor → Settings:
Statistics
To better understand the performance and availability of your services, we offer a variety of monitor statistics. The availability and probe duration along with other metrics are displayed in your monitor overview, which looks like this:
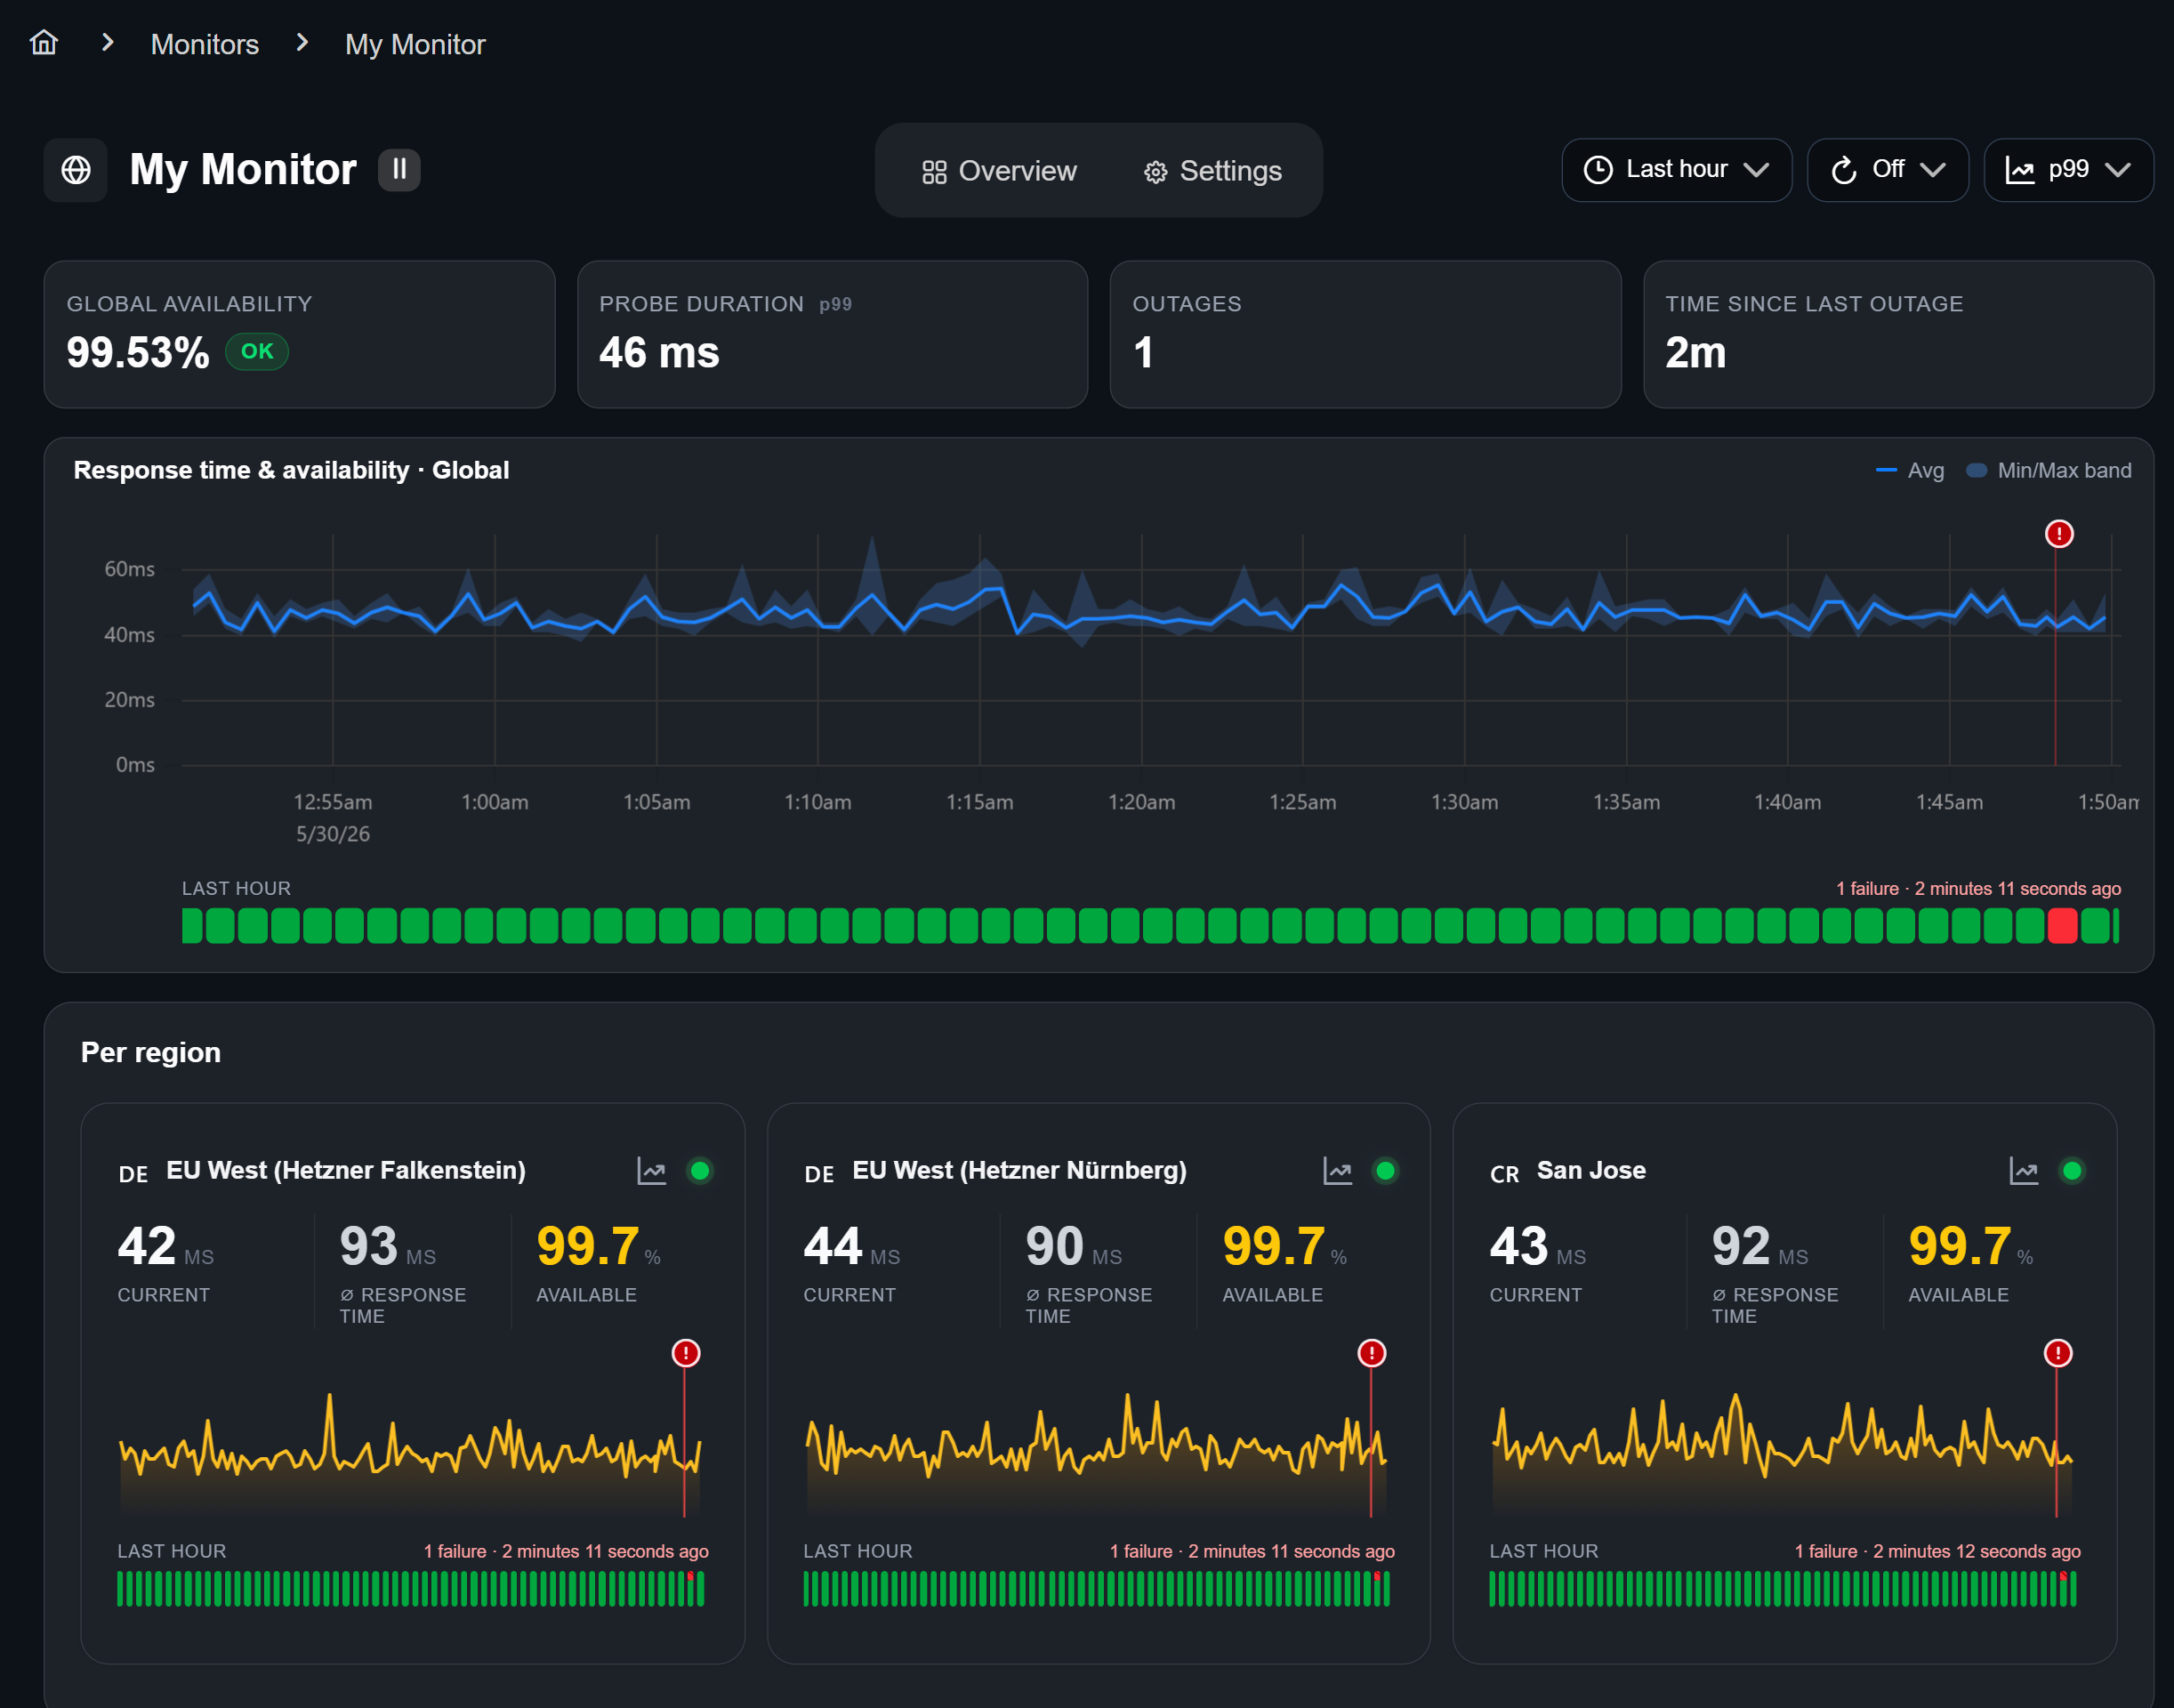
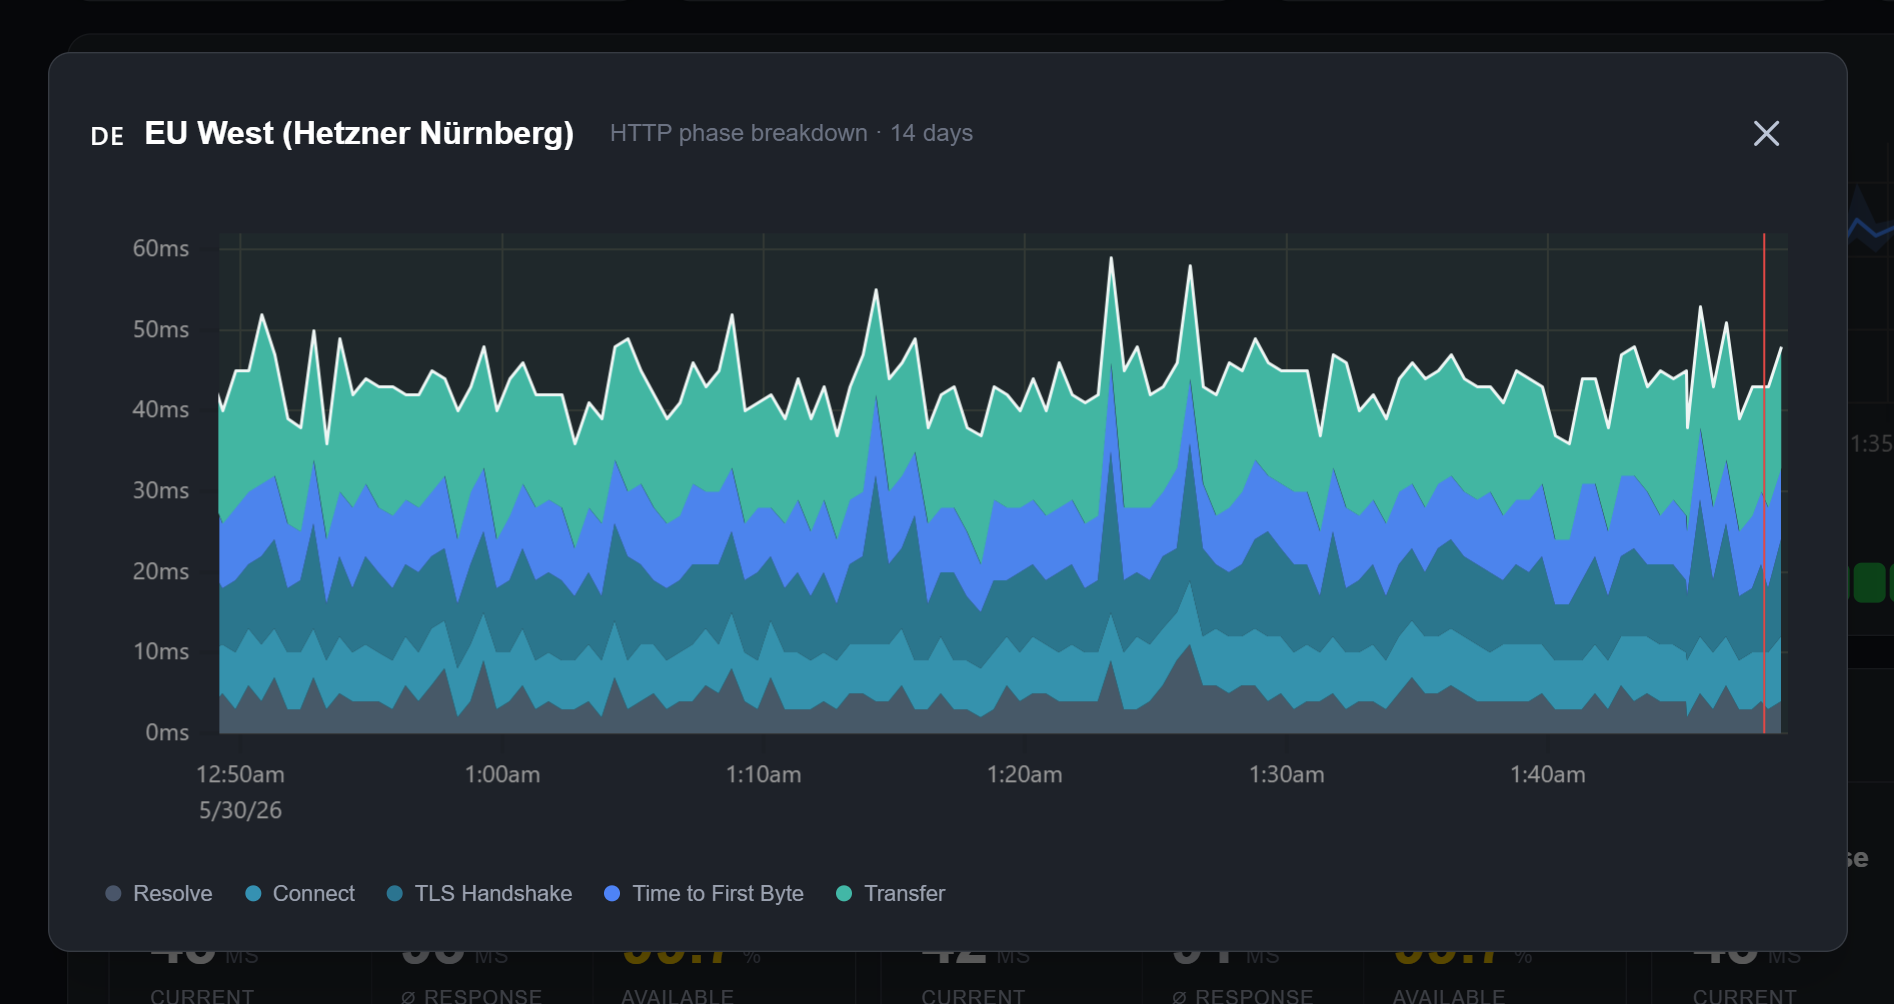
You can narrow down the timeframe of your data by scrolling while hovering over the graph. By clicking the graph symbol in any region card you will find the HTTP phase breakdown:
Here's what they stand for:
-
Probe duration is the total time from request inititation to the last byte of response.
→ often used to understand the end-to-end performance of the monitored system
-
Resolve measures the time required for a DNS resolution.
→ indication for the DNS resolution performance
-
Connect is the time it takes to build a TCP connection after a DNS resolution.
→ indicates network latency and the server’s ability to accept connections
-
TLS Handshake defines the required time for the negotiation and establishment of a secure SSL/TLS client-server connection.
→ shows the overhead of setting up encryption
-
Time to first byte is the total time from request initiation to the first byte of response.
→ helps in assessing the server's responsiveness
-
Transfer marks the time it takes from the first byte of the response to receiving the full response.
→ measures the download speed of the content from the server after the connection has been established
Outages
You will find your monitor's outages by scrolling down:
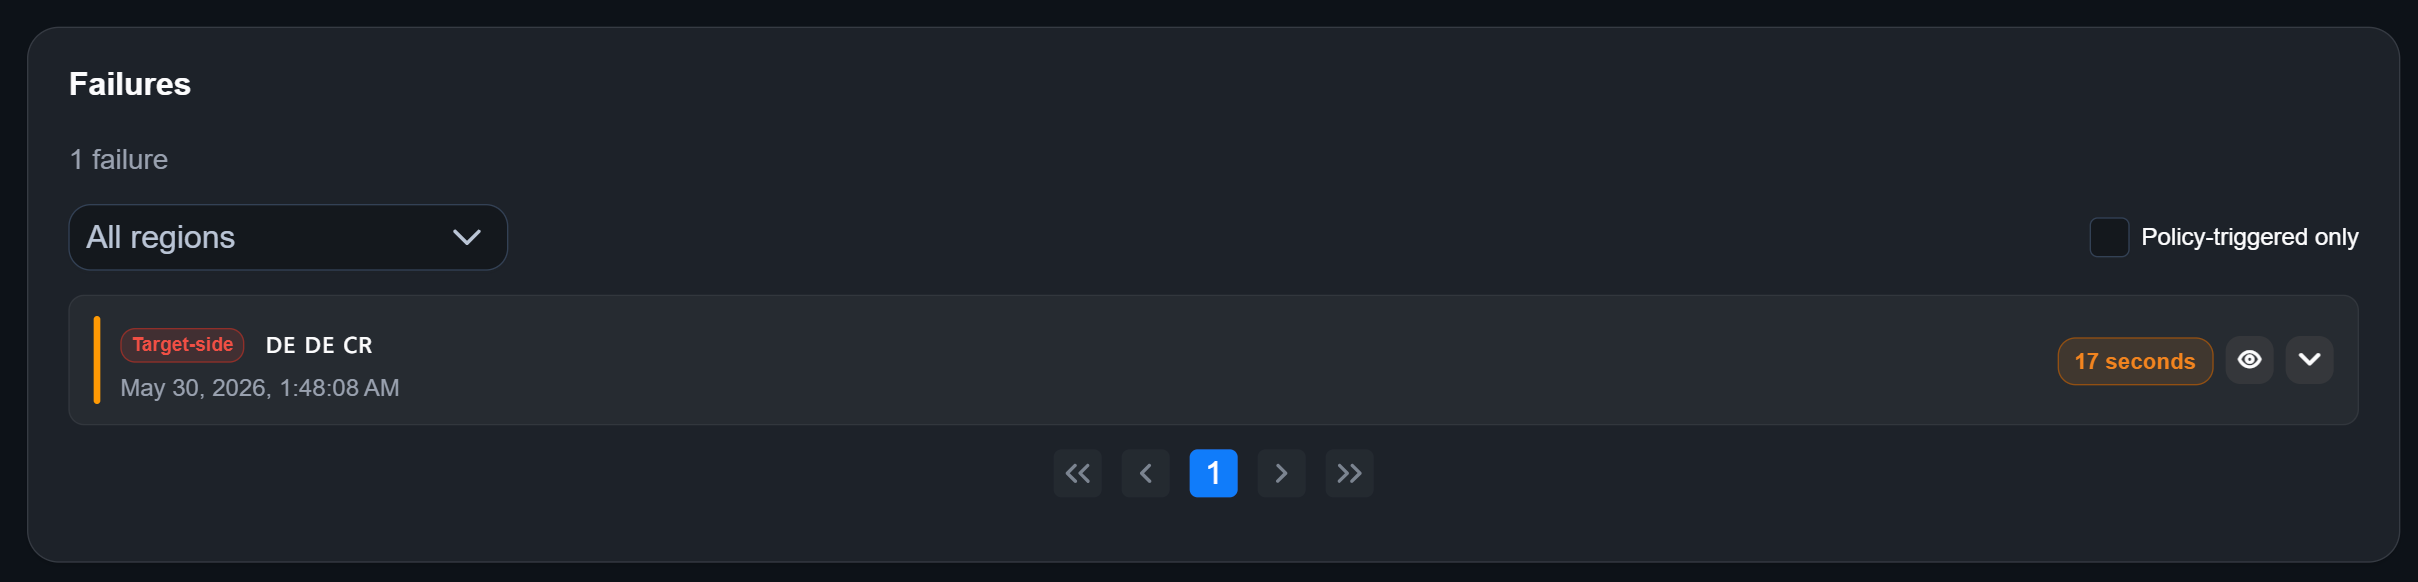
You can filter them like this:
- Regions (dropdown menu): Only shows you outages from specific regions.
- Policy-triggered only (checkbox on the right): Outages resulting from the failure rule you set (Settings → Regions → Failure rule)
Percentiles and timespans
For a further analysis of each of these metrics, p50, p90 and p99 can be used. They're statistical measures used to understand the distribution and reliability of data, especially in performance monitoring.
-
p50 (50th Percentile): Also known as the median, p50 indicates the middle value of a data set. For example, in response time data, P50 tells you the point at which 50% of requests are faster and 50% are slower. It represents an average experience for users.
-
p90 (90th Percentile): This value shows that 90% of requests are faster than this threshold, while the other 10% are slower. It focuses on the upper end of typical performance, indicating what most users experience in nearly all cases.
-
p99 (99th Percentile): In this case, 99% of requests are faster, and only the slowest 1% are slower. It’s useful for identifying outliers or worst-case scenarios, such as occasional high response times.
To get a better scope of your service's perfomance, every metric can be viewed for the last hour, day, week and month.